Version 24
Additional data tables and customizable step size on graphs.
July 07, 2025
Add up to 6 data tables
In the Statistics and Regressions applications, you can now input up to 6 data sets.
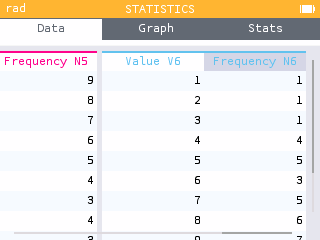
Access graphs or statistical tables for all 6 data sets.
Change the step size of the axes in Grapher
In the Grapher, Regression and Sequence applications, you can adjust the step size in the Axes menu.
Explore your trig graphs with a step size of π.
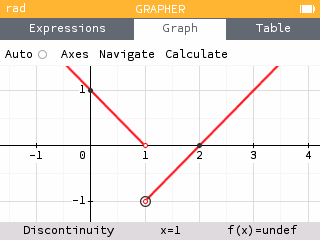
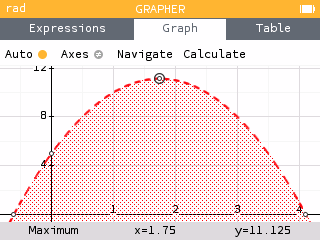
Discover discontinuities
In Version 24 we are introducing open circle points to our Grapher. Points of discontinuity will be displayed for piecewise functions, step functions and inequalities.
Piecewise functions now display open circles for end points that are not included in the graph.
Inequalities that are strictly less than or greater than will have open circle interest points.
Intersections for Inequalities
Intersections of inequalities are now included as a point of interest on the graph.
Use your left and right arrows to snap to intersections on inequalities on the Graph tab.
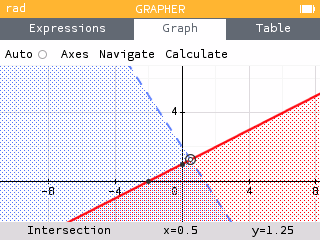
We've also added points of intersection to the Find menu for inequalities as a way to snap directly back and forth between intersections.
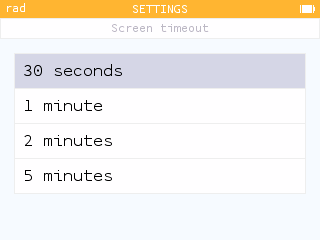
Change standby time
We've added a Screen timeout option in the Settings application, to allow you to set the duration of inactivity before going to sleep.
Additionally, new messages are available to improve communication around battery life and health. We'll notify you when your battery is at 20%, and provide a recommended charging time to ensure your battery stays strong over time.
Updates to the math engine
In this software version, we've extensively modified our math engine, making it more flexible and powerful. The result is greater accuracy in our calculations and better management of mathematical objects. Many of these features will be undetectable, but are essential to long term growth of our software.
As a result of this improvement, you may notice increased input size of complex calculations involving matrices, increased accuracy of logarithmic functions where the result is a fractional value, and that outputs including units of measurement will better match user expectations (including operations with science constants).
But wait, there's more!
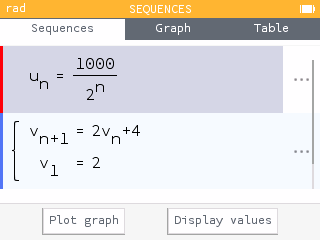
We have updated the Sequence application, to make it more consistent with our Grapher application.
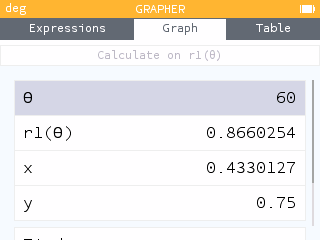
We have added x and y values for polar graphs in the calculate menu on the Graph tab of the Grapher application.
Recoverable Data After Exam Mode
Now, Python scripts, expressions, functions, lists, and equations created before entering exam mode may be restored after leaving exam mode, depending on available memory. During exam mode, the calculator may delete recoverable data if more space is needed for current operations.