Version 25
Pie charts, systems of inequalities and easier trig computations.
January 15, 2026
Categorical data
In the Statistics application, you now have the option to choose between quantitative and categorical data.
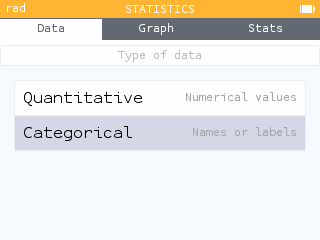
Up to 10 categories are possible for 6 groups. You can even rename your groups and categories to customize your tables.
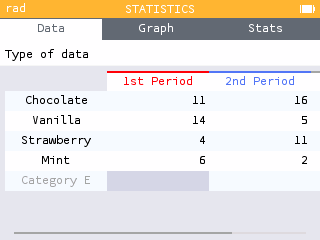
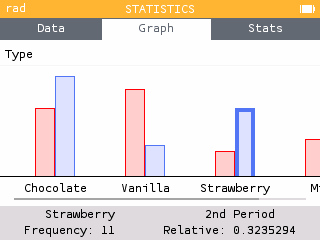
Categorical data can be represented by a bar chart or pie chart!
Region of intersection of inequalities
In the Grapher application, you can now display the region of intersections for inequalities. Use the Find menu to display the Region of intersection for inequalities.
Navigate to the vertices of the region to clearly see where your shading overlaps.
Approximate fractions in calculations
We've added approximate fractions to our additional results for decimal computations with 5 or more decimal places.
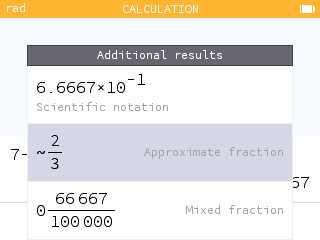
Now see fractional forms of repeating decimals even if you input them in truncated form.
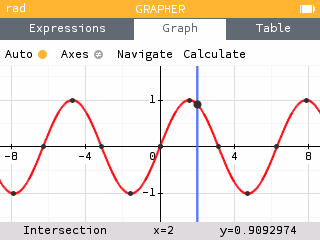
Intersection points for conics and vertical lines
In the Grapher application, we've added points of interest for intersections of conics and vertical lines!
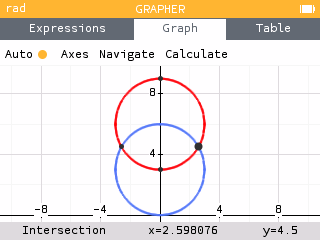
Now your tracer will snap to these intersections and you can use your Find menu to find the intersection points.
These intersections also work with functions and explicit equations!
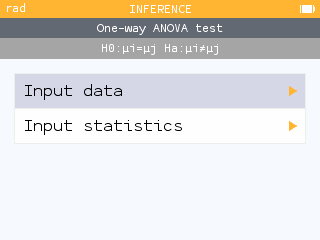
One-way ANOVA test
New test available in the Inference application: One-way ANOVA.
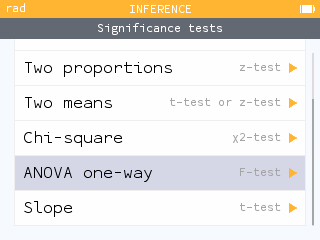
Two input modes are available: raw data or summary statistics.
We would like to thank the contributor who helped develop this feature: Jason Morales, Math professor, CA.
Quick access to Degree symbol
It's now even easier to compute trig functions in a unit of measurement different from your settings! With your calculator set to radians, input your trig and degree measurement. Toolbox now brings the degree unit to the very top for quick access.
New notation for defining sequences
In the Sequences application, you can now choose the notation for Recursive sequence. In the options, you can change the sequence notation from Un+1 to Un.
And also...
- The results in the Calculations app are now right-aligned, making it easier to quickly read approximate results when the exact results are long.
- Our auto-zoom algorithm has been improved to provide better graph framing.
- External applications are now preserved after a calculator crash.
- The software security level has been increased. Starting with this version, it is no longer possible to roll back to a version earlier than 24.11.