Version 20
Improved grapher, new periodic table application and additional results
January 31, 2023
Grapher improvements
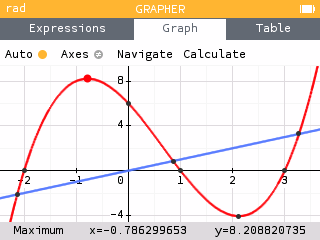
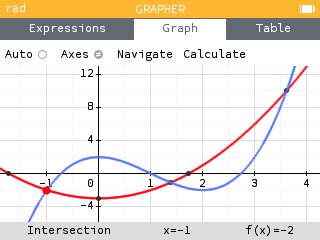
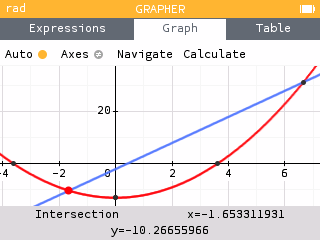
The selected curve now automatically shows points of interest in black. When tracing a curve, the cursor automatically snaps to these points and the legend indicates what kind of point it is. Interesting points include maximums, minimums, intercepts and intersections.
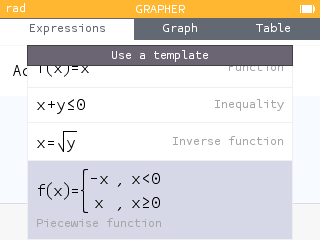
The calculator is now able to handle piecewise functions. To add a piecewise function, use the corresponding template and enter your desired expressions and domains.
It is now possible to plot inverse functions by expressing the equation of the curve as a function of y.
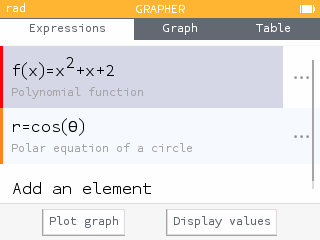
The expression legends have been improved and now give more precise information about the expressions in the list.
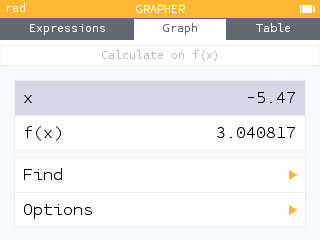
The Calculate menu of the Graph tab has been reorganized. It now allows access to the values of x and f(x) so that they can be copied or stored.
The Calculate menu has a new feature that allows you to calculate the area between two curves.
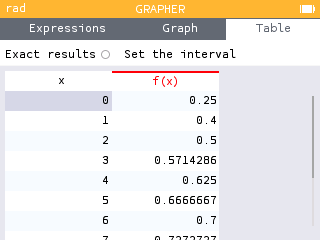
The table of values now gives the exact value of function outputs. To display exact values, activate the Exact results option.
Other improvements have also been integrated into the Grapher:
-
A new template is now available in the Expressions tab:
y=x. -
The equations of polar curves are now written in the form
r=cos(θ)instead off(θ)=cos(θ). - The algorithm that sets the best automatic window to observe the curves has been improved based on user feedback.
- The first column and column headers in the table now remain fixed as you move through the table.
- The value of the deriviative of a function can now be turned on using the Options section of the Calculate menu. Turning on the value of the derivative will display it in the Graph and Table tabs.
Periodic table of elements
The new Elements application offers a periodic table of elements. By default, the elements are presented by families: Alkalines, Alkaline-earth metals, Transition metals, etc.
The name of the selected element is displayed above the table with its symbol, atomic number and mass number. The legend at the bottom of the screen indicates the family of the element.
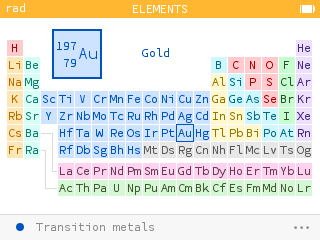
Pressing OK or EXE allows you to view the information of the selected element. Here you will find its properties such as its electronic configuration, its electronegativity, its melting and boiling temperatures, etc.

You can start typing the name of the element or its atomic number to find it in the table. Use the numeric keys or the alpha key followed by an alphabetic key.
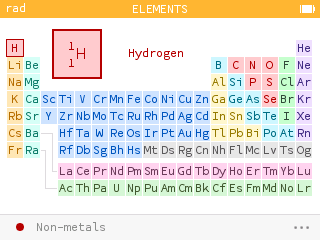
The menu with the three dots at the bottom of the screen allows you to choose a different display. For example, you can observe how the electronegativity of the elements evolves according to their place in the table.

Units and constants
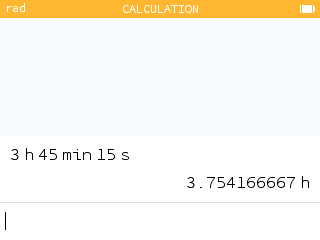
It is now possible to use angle units, including degrees minutes seconds. This new feature allows you to calculate with an angle measure that is different from the mode of your calculator. It is also helpful in the case of conversions. For example, you can convert degrees to radians.
The use of an underscore is no longer necessary to indicate units. However, it is possible to use it to remove ambiguities in the case where a variable has the same name as a unit.
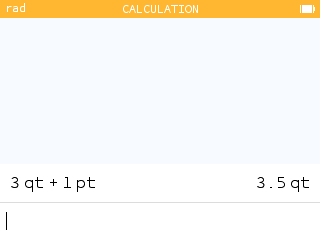
Some units can be used with implicit addition, such as hours, minutes, seconds and yards, feet, inches.
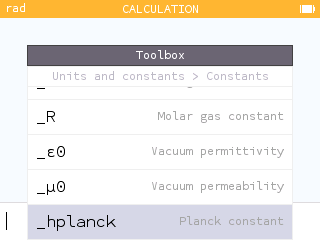
The Toolbox now contains the Planck constant.
Additional results
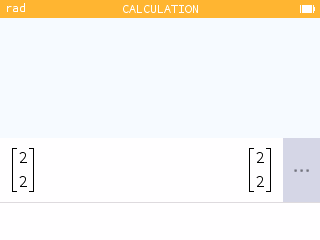
When you enter a vector row or column, you can open the additional results to access a graph as well as information such as the magnitude, the associated unit vector and the angle with the positive x-axis.
Calculations involving basic functions now display a graphical representation in the additional results.
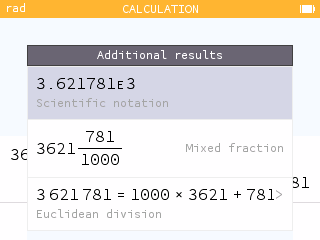
For numerical results, the additional results screen now displays the corresponding scientific notation.
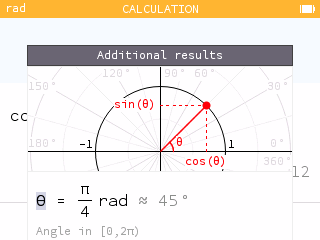
Trigonometric addtional results now include a polar grid. The measure of the angle is also provided in radians and degrees along with the value of the tangent. Additional results are also now available for inverse trigonometric functions.
Improved expression input experience
Open parentheses are now autocompleted with closing parentheses and vice versa. The autocompleted parenthesis appears in gray.
Certain terms are beautified when typing, such as pi for π,
theta for θ ,<= for ≤, and ->
for →. Other functions include abs, piecewise, root, sqrt, int, diff, conj,
binomial, norm, ceil, floor, exp.
To help students better understand order of operations, we automatically add paranthesis in the display of negative squared values.

But wait, there's more!
This version also offers many other improvements.
It is now possible to define a variable from any screen. To do this, highlight the value and press shift then pow. Assign a name to the variable and press EXE.
The cursor now blinks when you are editing text.
The cursor has been redesigned when selecting points to be more consistent with the graphic interface.
When calculating percentages, a new symbol appears to indicate that a value has been increased by a certain percentage. We thank Vincent Robert for this suggestion!
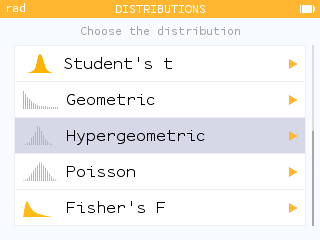
A new probability distribution has been added to the Distributions application: the hypergeometric distribution. The corresponding functions have also been added to the Toolbox.
- The home screen of the calculator now shows 3 additional applications: the Elements application (periodic table), the Distributions application (originially contained in the Inference application) and the Finance application (originially contained in the Solver application).
- Pressing zero on the home screen is a new shortcut to the Settings application.
- The Calculus section of the Toolbox now lists a Derivative of order n function.
-
The Toolbox now has a Logic section
containing some logical operators. It is also possible to use the sign
=to perform tests. - The new randintnorep(a,b,n) function of the Probability > Random section of the Toolbox allows you to simulate a draw of n random integers between a and b without repetitions.
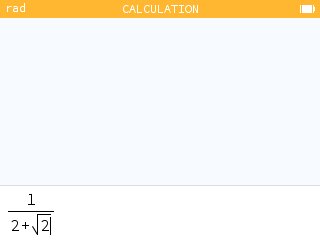
- You can now press the division key multiple times to cycle through fraction templates including a mixed fraction. You can also input a mixed fraction using the template found in the Arithmetic section of the Toolbox.
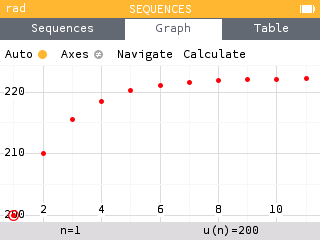
- The Sequences application now offers a Coweb graph representation of a recursive sequence.
-
A new linear model is available in the Regression
application:
a + bx. - The final screen of a confidence interval is now dynamic. You can scroll between different confidence levels to see how the interval is changed.
-
Inverse trigonometric functions now display as
arccos()instead ofacos().