Version 26
Dark mode, accessibility, and points of interest for derivatives.
July 06, 2026
Dark Mode
It's here! The calculator now offers a dark mode! Enable Dark Mode from the Accessibility menu in the Settings app by turning on High Contrast. We're excited to offer this highly requested feature, but it is more than just a Dark Mode. This feature is specially designed to comply with WCAG 2.0 AAA, ensuring more students have access to the tools they need.
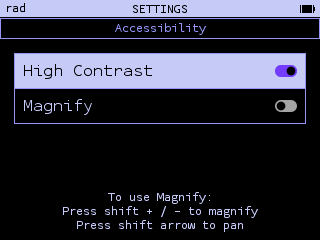
Accessibility
As part of our commitment to making the calculator more accessible to everyone, in addition to High contrast settings we've also added new features across various apps!
Magnify
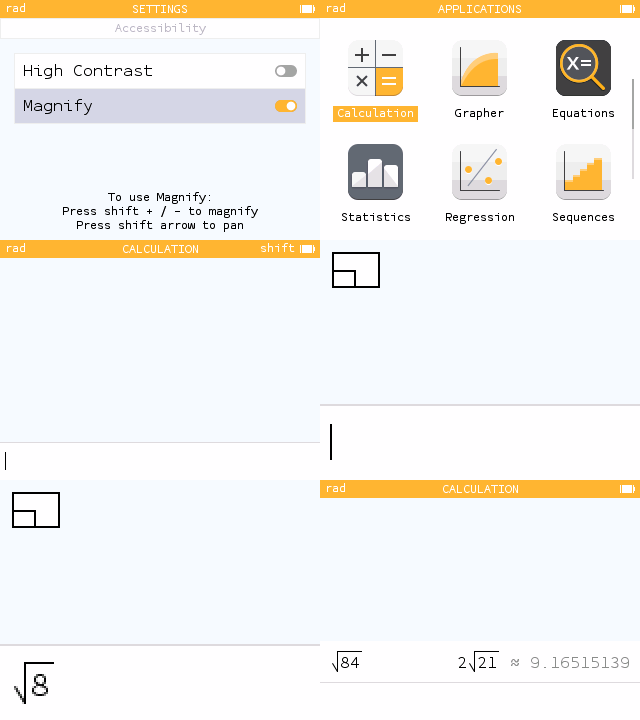
Also in the Accessibility menu of the Settings app, we've added a Magnify option. When enabled, you can use shift + and shift - to magnify the screen. The magnifier is designed to find your cursor helping you clearly see your input.
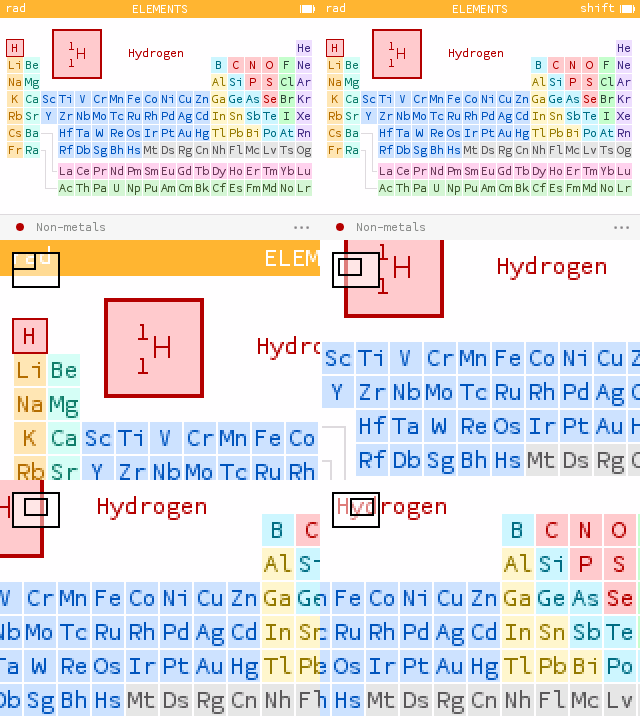
You can also use the magnifier to explore other areas of your screen. When zoomed, press shift followed by an arrow to pan your screen.
Improvements for Statistics and Regression
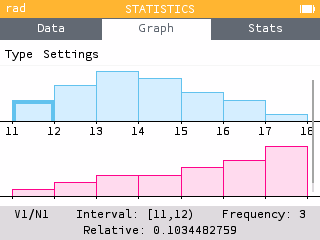
In the Statistics and Regression apps, you can now change the colors of data series from the column options! The selected color is then automatically applied to the graph, allowing for a more personalized visualization. Additionally, in the Statistics app, histogram selection has been improved to comply with WCAG 2.0 AAA accessibility guidelines.
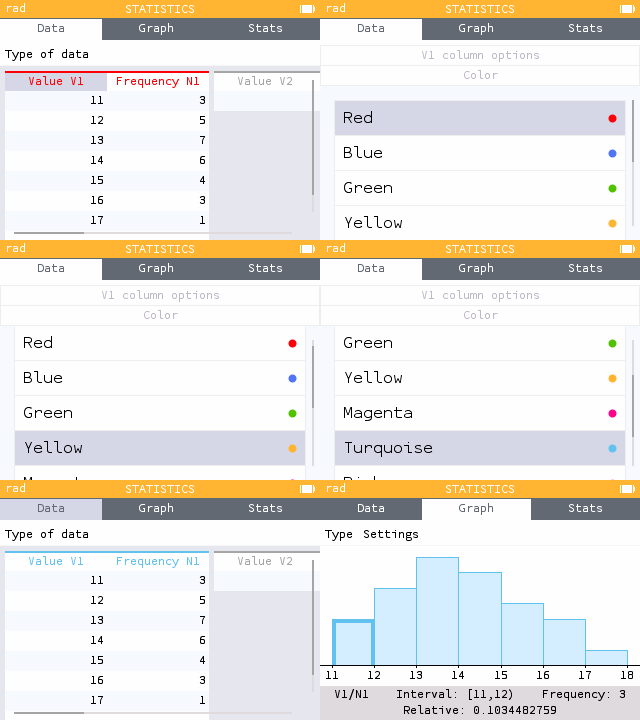
Unselected histograms and box plots now retain their assigned colors for better graph readability.
Improvements for error messages
The final accessibility improvement is to syntax error messages, which are now clearer and more explicit, helping you quickly understand the problem.
More Holes!
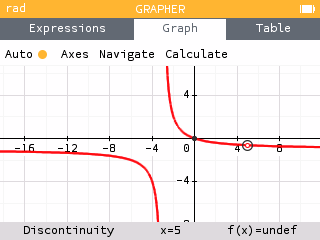
In Version 24, we brought open circle displays to the Grapher app for inequalities and piecewise functions. Now, we're including them for many rational functions! For rational functions with holes at whole number values, we now display an open circle that you snap to as you trace.
Key Features of Derivatives
In the Grapher app, toggling on the plot of the derivative now offers new possibilities! When you toggle on a first or second derivative from a function's options, you can now snap to key points, just as you can for the function itself.
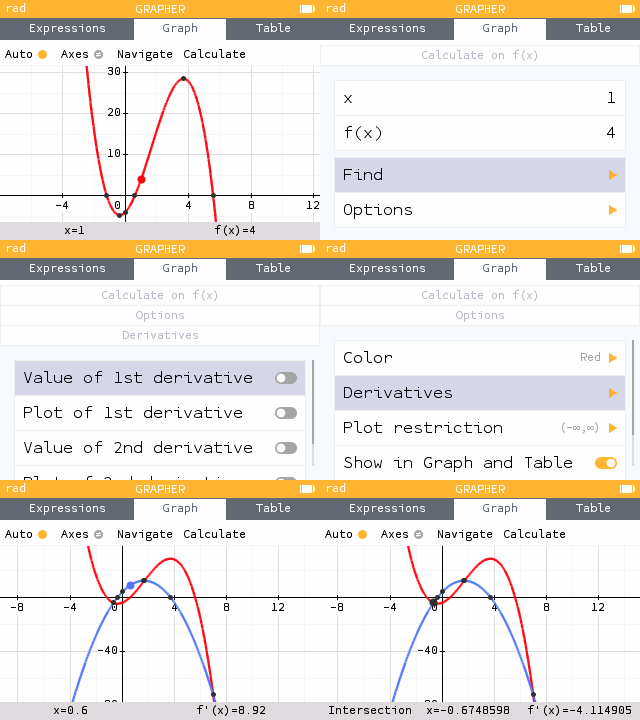
Derivatives also have their own Find menu allowing you to calculate extreme values, intersections, integrals and more for derivative plots.
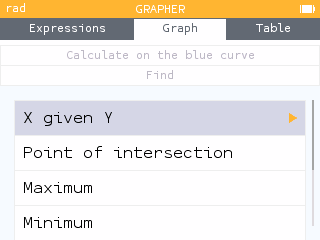
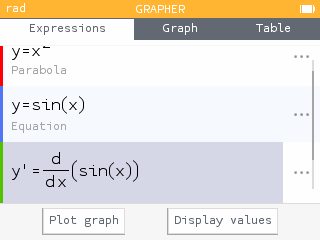
We've also improved how derivatives are displayed when toggled in the Expressions tab.
Polar Grid Adapts to the Calculator's Settings
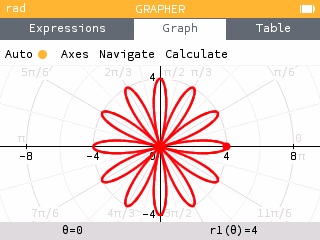
We've added a radian version of the polar grid in the Grapher app. Now, whether your calculator is set to radian or degrees, your polar grid will match the settings.
Residuals Stored in a List
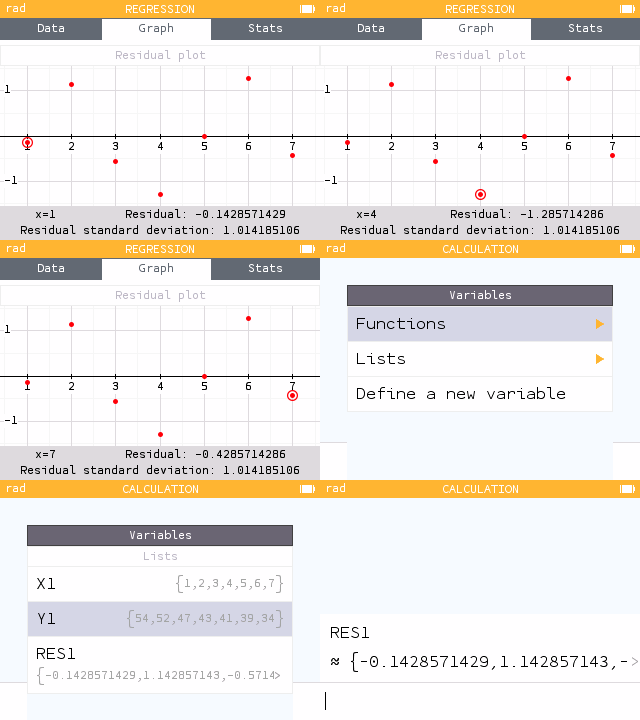
In the Regression app, the residuals from your model are now automatically stored in a list in the Variables menu. This allows you to reuse them directly in your calculations or other applications.
Clearer placement of i
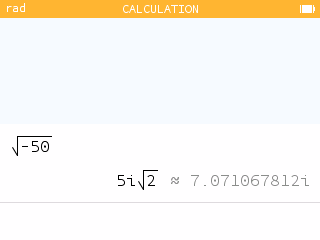
We've updated our placement of i in complex values to make it clearer when i is outside of radicals. Now i will appear before radicals.
And also...
- Several probability distributions that were previously only accessible in the Probability app are now available from the toolbox.
- The Student and Fisher distributions now support a wider range of degrees of freedom.