Daylight
Sinusoidal regression Writing, graphing and analyzing trigonometric functions
Objective
The objective of this activity is to create and analyze sinusoidal equations by looking at sunrises and sunsets to determine how many minutes of daylight we experience in a year.
You have probably noticed that the sun rises and sets at different times throughout the year. Some days are really long while others are really short.
In this activity, you will use data about sunrise and sunset times to create a function that models the number of minutes of daylight on a given day of the year.

Create a function
Below is a table containing the number of minutes of daylight on the 1st and 15th of each month in Paris, France during 2021.
| Date | Day of Year | Daylight (minutes) |
|---|---|---|
| January 1 | 1 | 501 |
| January 15 | 15 | 523 |
| February 1 | 32 | 558 |
| February 15 | 46 | 613 |
| March 1 | 60 | 662 |
| March 15 | 74 | 712 |
| April 1 | 91 | 774 |
| April 15 | 105 | 823 |
| May 1 | 121 | 876 |
| May 15 | 135 | 917 |
| June 1 | 152 | 954 |
| June 15 | 166 | 969 |
| Date | Day of Year | Daylight (minutes) |
|---|---|---|
| July 1 | 182 | 966 |
| July 15 | 196 | 946 |
| August 1 | 213 | 905 |
| August 15 | 227 | 862 |
| September 1 | 244 | 805 |
| September 15 | 258 | 756 |
| October 1 | 274 | 699 |
| October 15 | 288 | 650 |
| November 1 | 305 | 592 |
| November 15 | 319 | 550 |
| December 1 | 335 | 514 |
| December 15 | 349 | 497 |
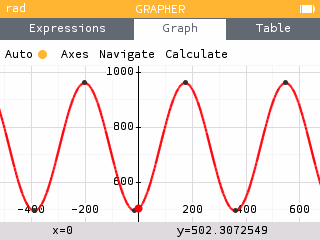
- Make a scatterplot of the relationship between the day of the year and the amount of daylight.
- Describe what the scatterplot reveals about the relationship between the day of the year and the amount of daylight.
- Based on the scatterplot, what type of function do you think would best model the data?
- Plot a regression model on your scatterplot. What is its equation?
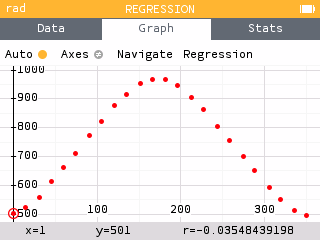
As the day of the year increases, the amount of daylight also increases at first, but then decreases. This corresponds to how there is more daylight in the summer (the middle of the year) but less during the winter.
A trigonometric function would best model the data.
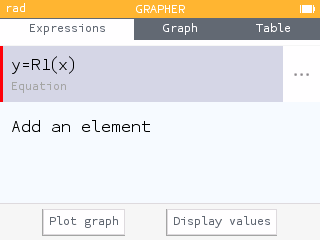
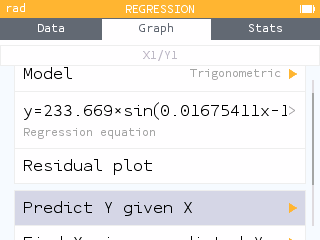
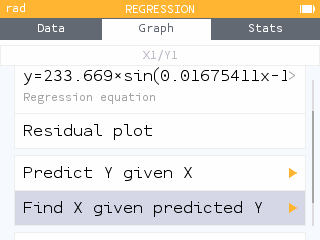
Using the Regression menu, we can add a trigonometric model.
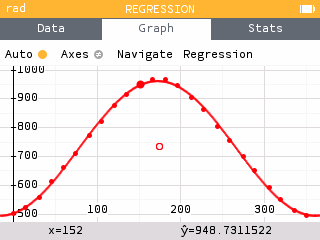
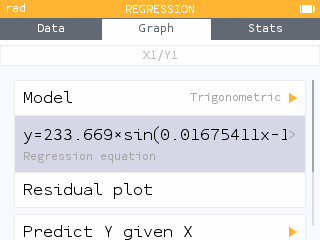
The equation of the model is .
Analyze the function
In the previous section, you may have selected a sinusoidal function to model your data. If you chose another type of function, go back and apply a trigonometric regression and compare the models.
Use a trigonometric regression model to answer the following questions. To connect dates with their corresponding day of the year, here is a helpful resource.
- Identify the amplitude of the regression model. Interpret its value in context.
- Identify the period of the regression model. Explain what it means in the context of this problem.
- Determine the maximum value of the function. Explain what this means in the context of the problem.
- September 10, 2021 (Day 253) is not a data point in the table. Use the regression model to predict the amount of daylight on this day.
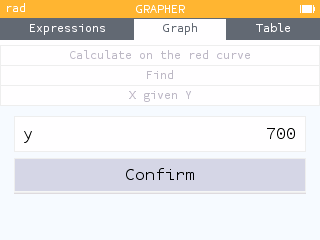
- On which date(s) in 2021 is it predicted that there will be 700 minutes of daylight?
The amplitude is . This represents the difference between the maximum or minimum and the midline. Doubling this value tells us the difference in the maximum and minimum minutes of daylight throughout 2021. That is, the longest day has about 467 more minutes of daylight than the shortest day. That's almost 8 hours!
The period is .
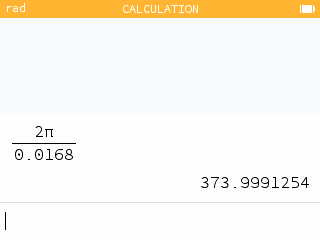
This should represent the number of days in one year. However, we know the real period is approximately 365 days.
The maximum value can be found in two ways:
Option 1: Using the equation
The maximum can be found by adding the amplitude to the midline.
Option 2: Using the graph
The maximum value can be found using the Maximum tool within the Calculate menu of the Grapher application.
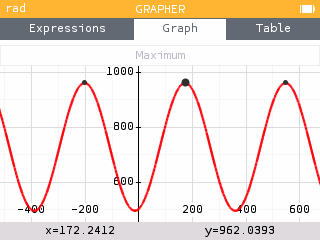
The maximum value is and occurs at .
In context, this means that the 172nd day of the year (June 21) has the most daylight of around 962 minutes, or 16 hours!
The predicted amount of daylight can be found using the Predict Y given X tool within the Regression menu of the Regression application.
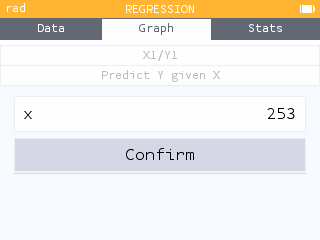
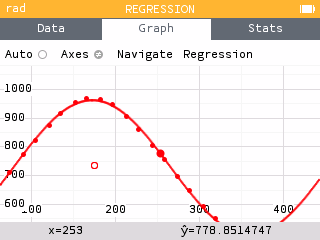
The predicted number of minutes of daylight on the 253rd day is 778.85 minutes, or approximately 13 hours of daylight.
The first day on which it is predicted to have 700 minutes of daylight can be found using the Find X given predicted Y tool within the Regression menu of the Regression application.

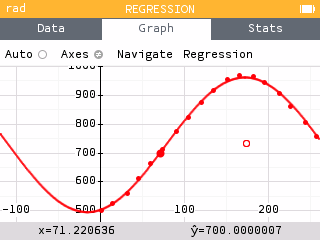
The first day of the year on which it is predicted to have 700 minutes of daylight is March 12.
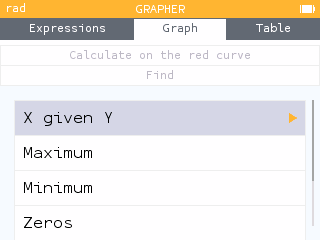
Because the Regression application only outputs the first positive x-value for a predicted y-value, it may be more useful to use the X given Y tool within the Calculate menu of the Grapher application.
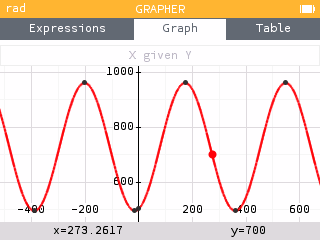
The two days within the year 2021 that are predicted to have 700 minutes of daylight are day 71 and day 273. That is, March 12 and Septemeber 30.
Extension
Navigate to www.timeanddate.com/sun. Search for a different city around the world and view its "Sunrise and Sunset" times. Scroll down on the page to see the amount of daylight each day in a given month.
The amount of daylight will be given in hours, minutes, and seconds. You can convert to minutes using the NumWorks calculator.
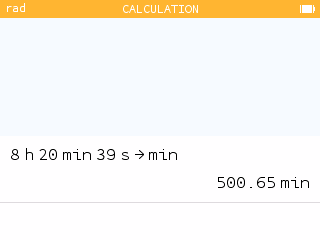
Record the number of minutes of daylight on the 1st and 15th of each month for 2021.
- Create a scatterplot for your data and apply a trigonometric regression. What is the equation of your model?
- Determine the amplitude and period.
- Determine the minimum value of the function. Explain what this means in the context of the problem.
- Use your model to predict the amount of daylight for September 10, 2021 (Day 253).
- On which date(s) in 2021 is it predicted that there will be 700 minutes of daylight?
- How do the values found above compare to those found from Paris, France? Why might these values be different?