Transportation Networks
Matrices Networks
Objective
The objective of this activity is to use matrices to represent data based on transportation networks.
Large cities often have highly-developed public transportation systems that help residents travel to and from other cities. Buses, trains, and subways are some of these modes of transportation.
A network diagram is a useful way to represent the different routes between cities. In this activity, you will explore routes between four large cities.

Bus Routes
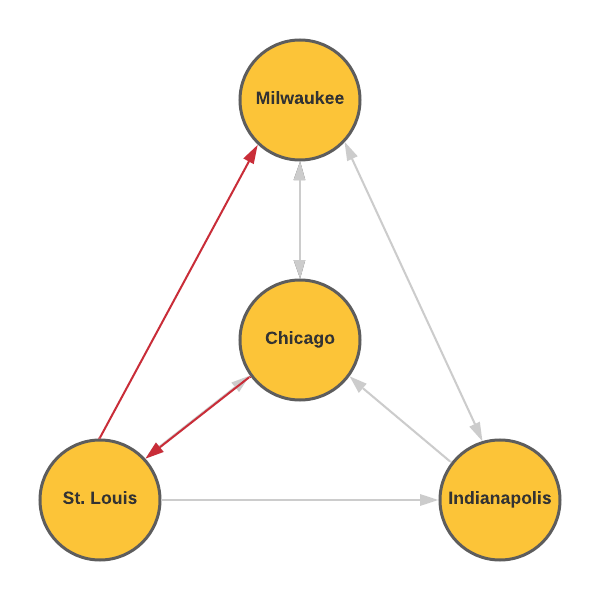
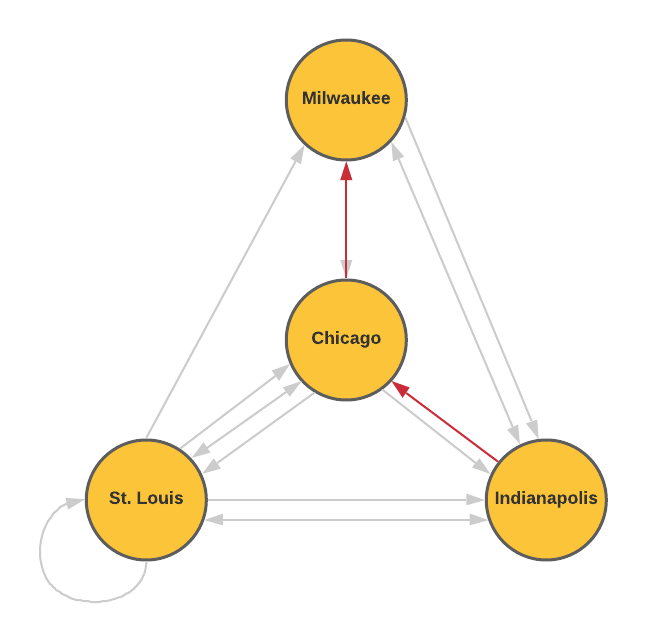
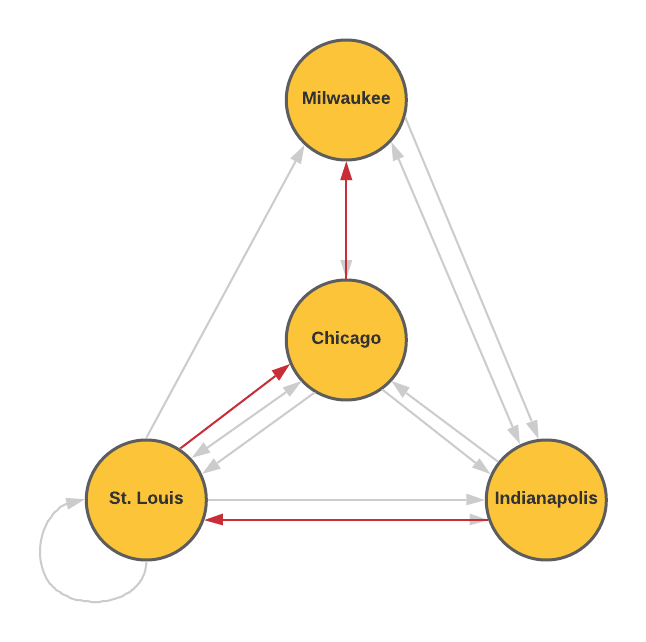
The network diagram below shows the bus routes that run between four large cities. The arrows indicate the direction the buses travel.
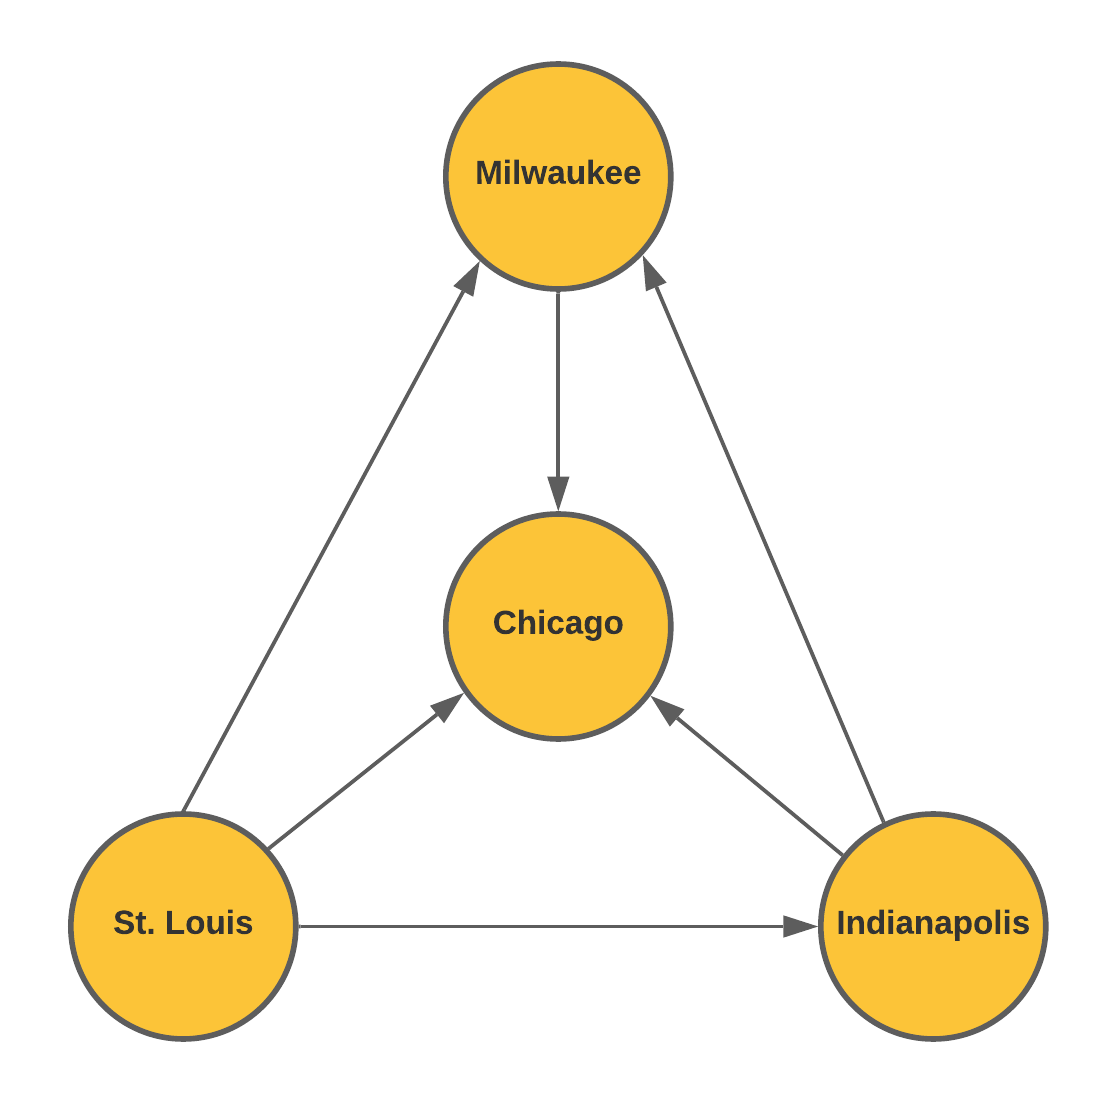
- How many ways can you travel from St. Louis to Chicago? Justify your answer.
- A travel agent is concerned that the diagram isn't correct. What about these bus routes seems suspicious?
There are four ways to travel from St. Louis to Chicago.
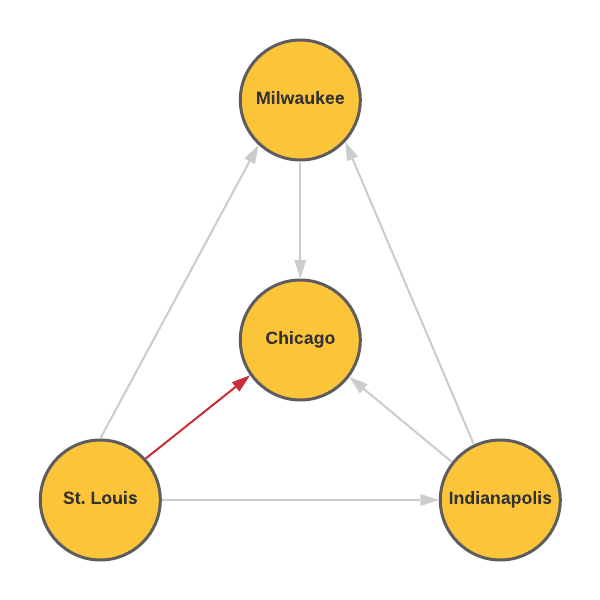
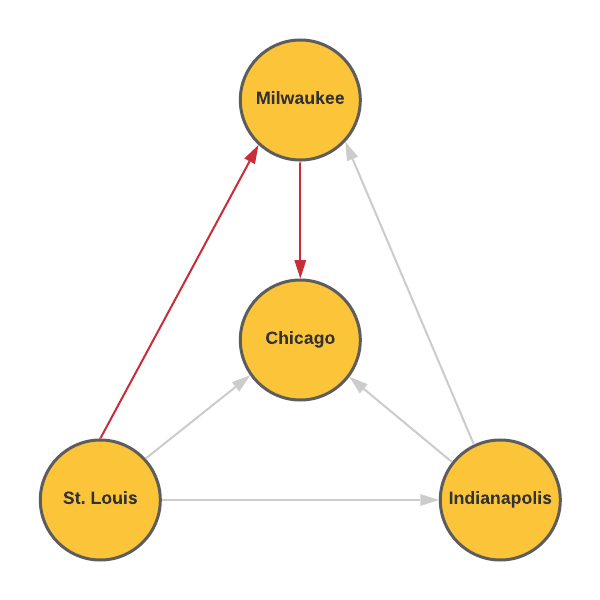
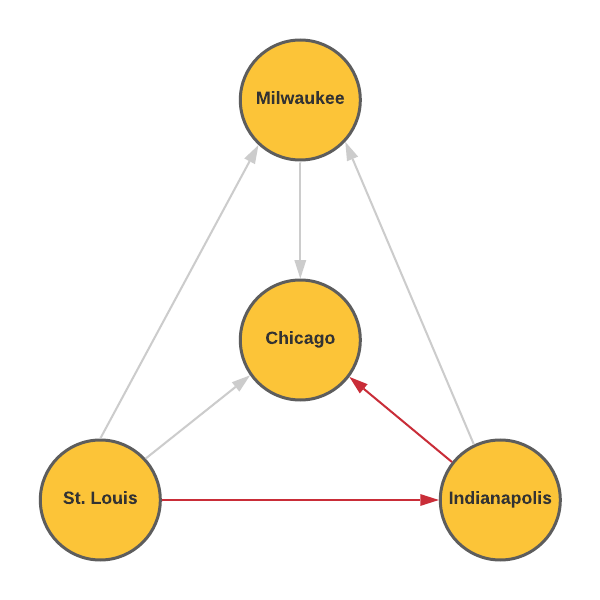
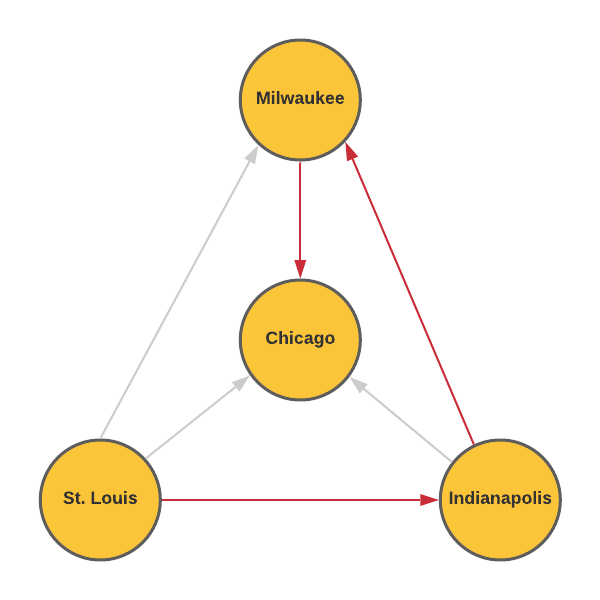
There is no route that leaves Chicago. It is also not possible to travel to St. Louis.
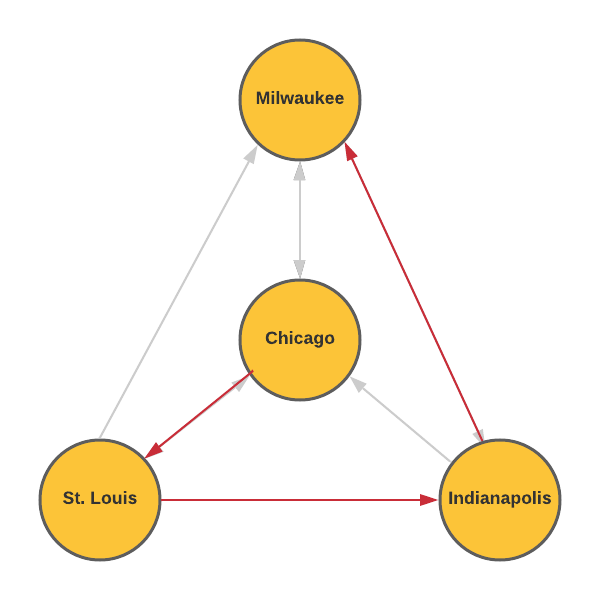
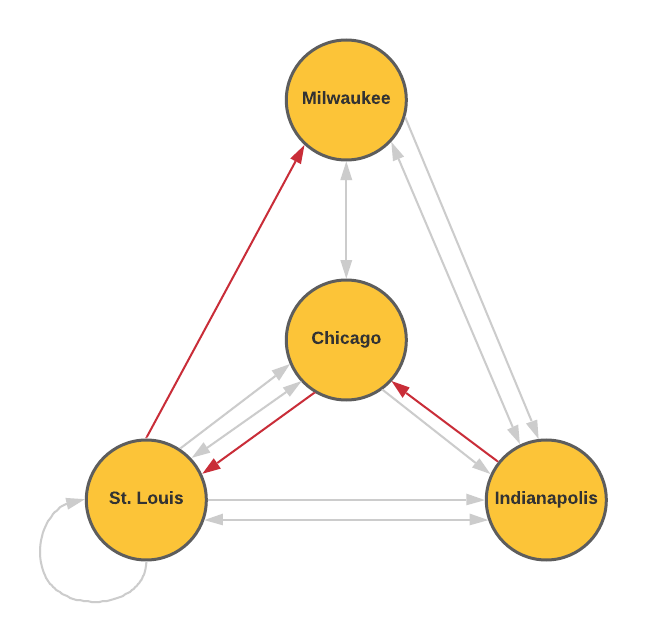
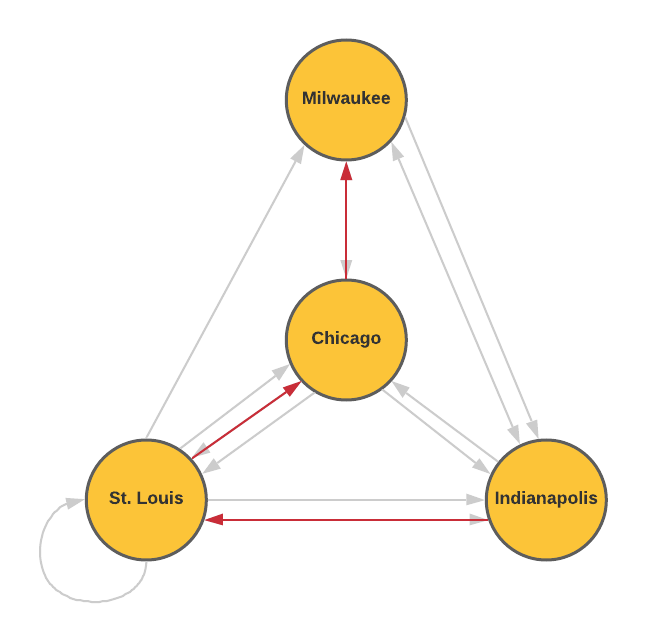
Upon inspection, the bus company realized there was an error in printing the map. An updated network diagram is shown below. Arrows on both ends of an edge indicate that buses travel in both directions.
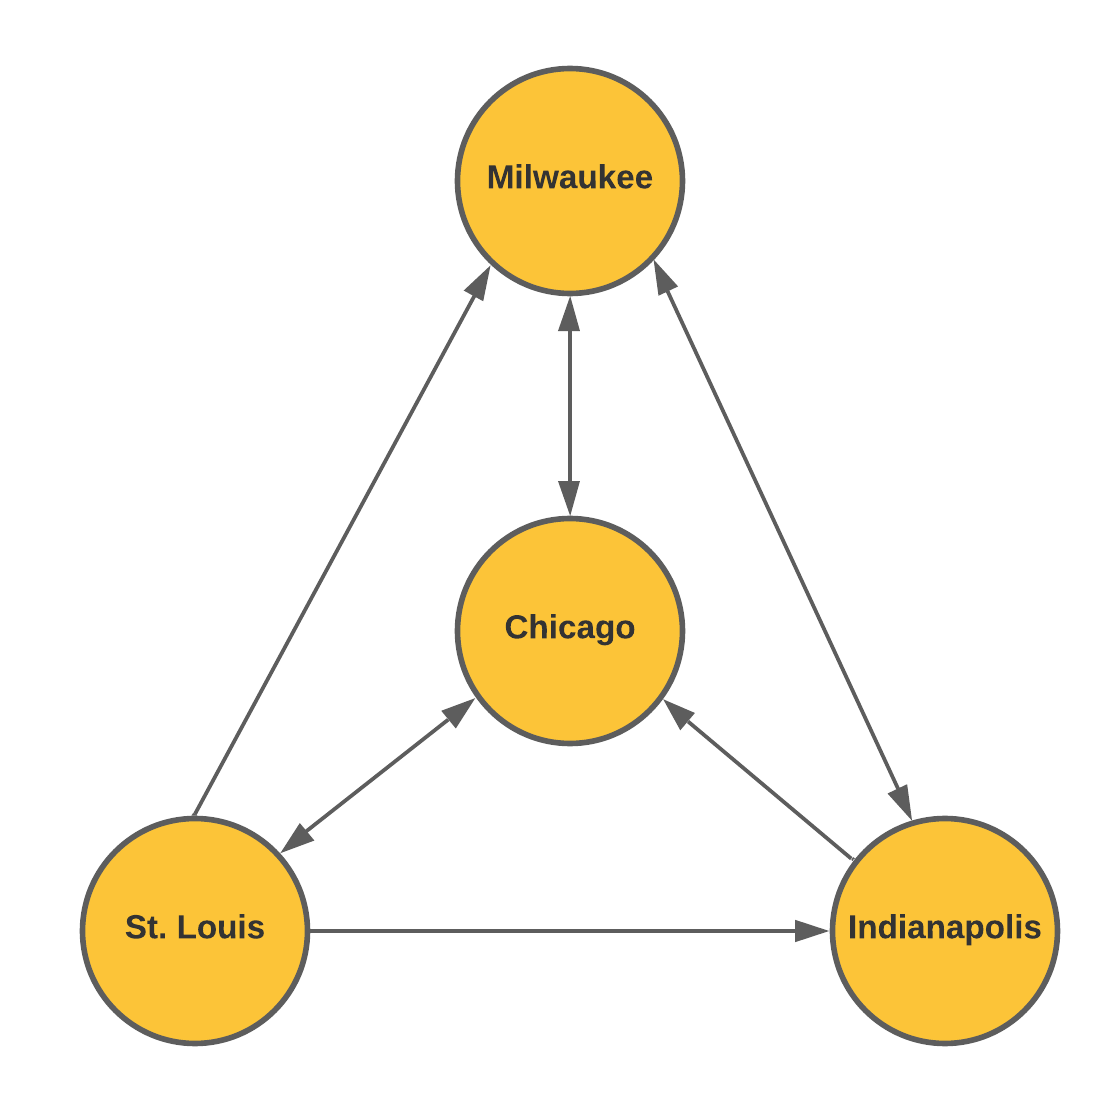
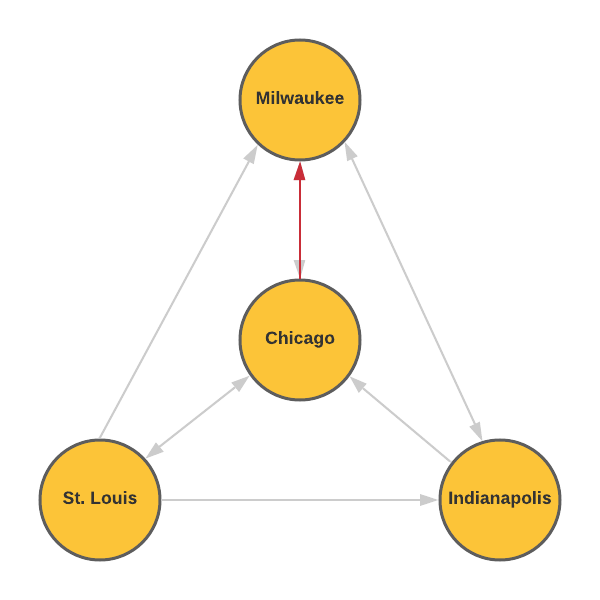
- How many ways can you reasonably travel from Chicago to Milwaukee using the route map? Justify your answer.
A reasonable way to travel is to not repeat any cities. There are three reasonably ways to travel from Chicago to Milwaukee.
Improved Bus Routes
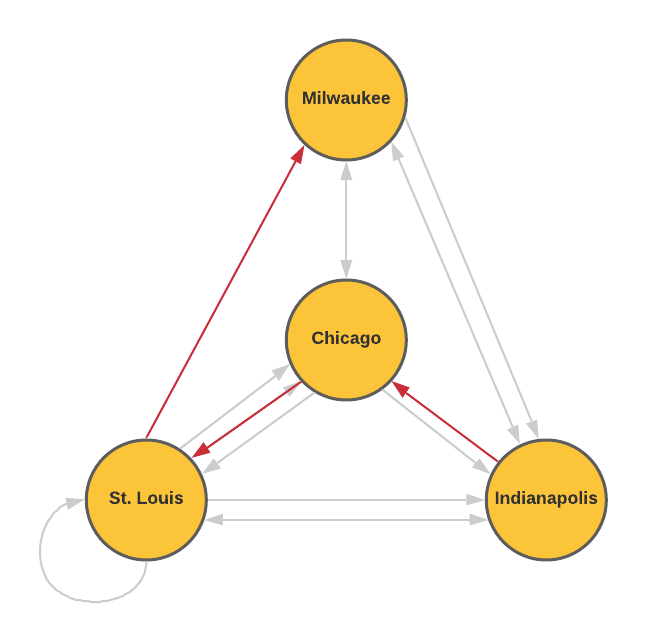
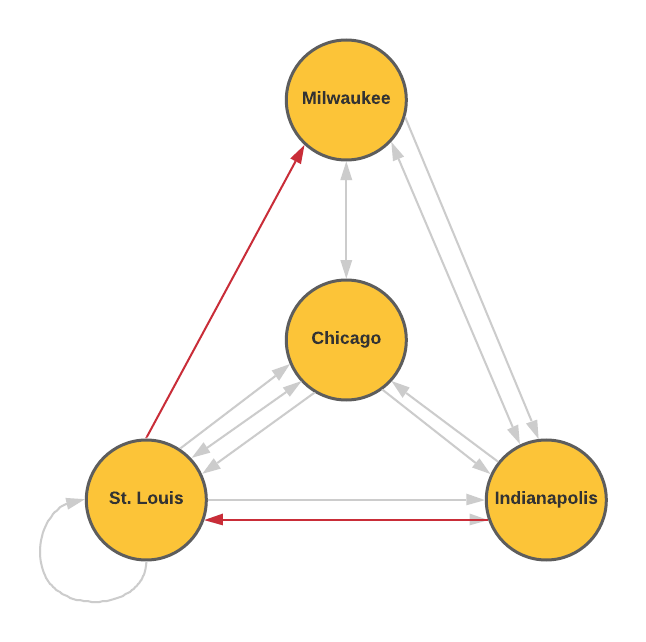
As the bus company grows, they begin offering more routes connecting these four cities as shown in the network diagram. Multiple arrows from the between the same two cities represent different routes.
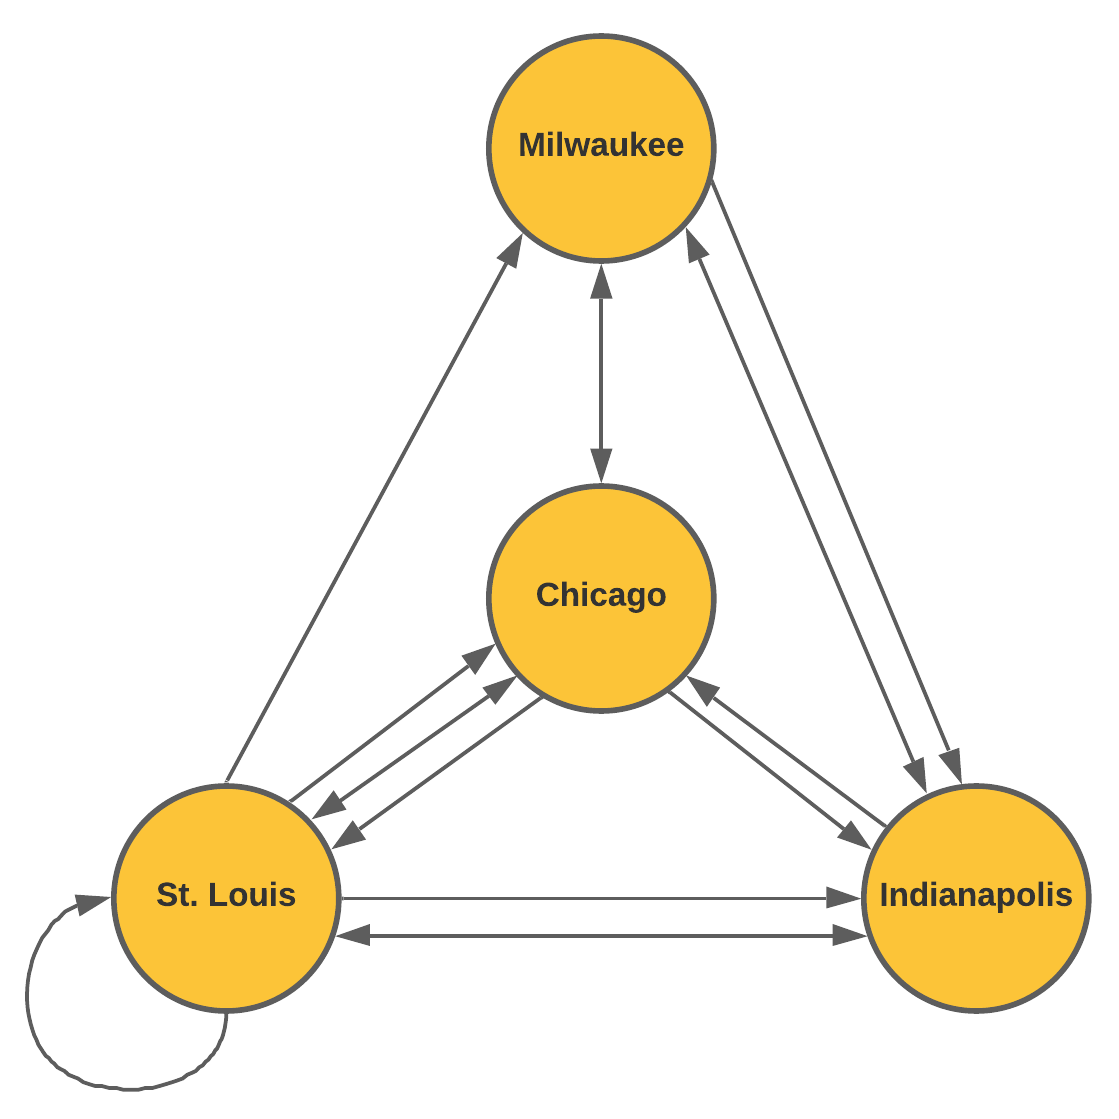
- What might the loop in St. Louis represent?
- How many ways can you travel from St. Louis to Chicago if you want to stop in Indianapolis and make no other stops?
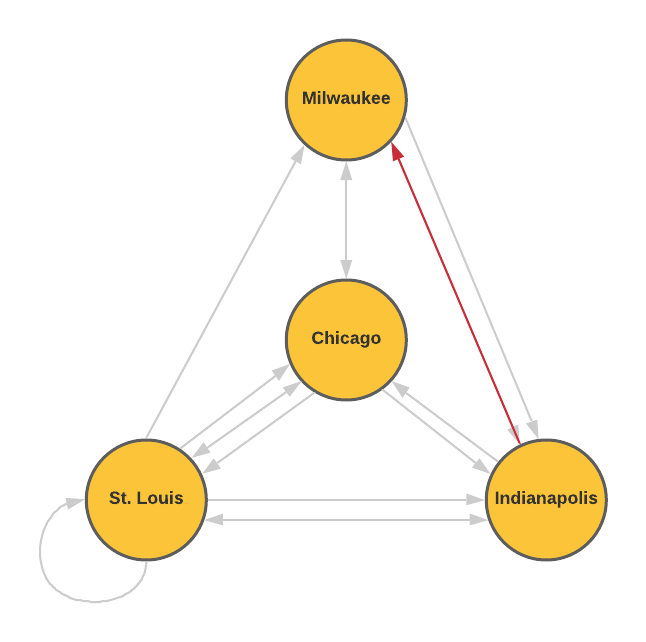
- How many possible ways are there to travel from Indianapolis to Milwaukee without repeating a city?
- Consider a "direct route" to be a route from one city to another without going through any other city. Organize the number of direct routes from each city into the table shown below. The first row showing the direct routes from Chicago to the other cities is completed for you.
This bus route takes you from one location in St. Louis to another location in St. Louis.
Since there are two routes from St. Louis to Indianapolis and only one route from Indianapolis to Chicago, there are two total ways to travel from St. Louis to Chicago while stopping in Indianapolis with no other stops.
There are seven possible ways to travel from Indianapolis to Milwaukee without repeating a city
| Chicago | Indianapolis | Milwaukee | St. Louis | |
|---|---|---|---|---|
| Chicago | 0 | 1 | 1 | 2 |
| Indianapolis | ||||
| Milwaukee | ||||
| St. Louis |
| Chicago | Indianapolis | Milwaukee | St. Louis | |
|---|---|---|---|---|
| Chicago | 0 | 1 | 1 | 2 |
| Indianapolis | 1 | 0 | 1 | 1 |
| Milwaukee | 1 | 2 | 0 | 0 |
| St. Louis | 2 | 2 | 1 | 1 |
Train Lines
A train line also connects these four cities. The network diagram below is updated to show both the bus and train routes. Solid lines represent bus routes and dashed arcs represent train routes.
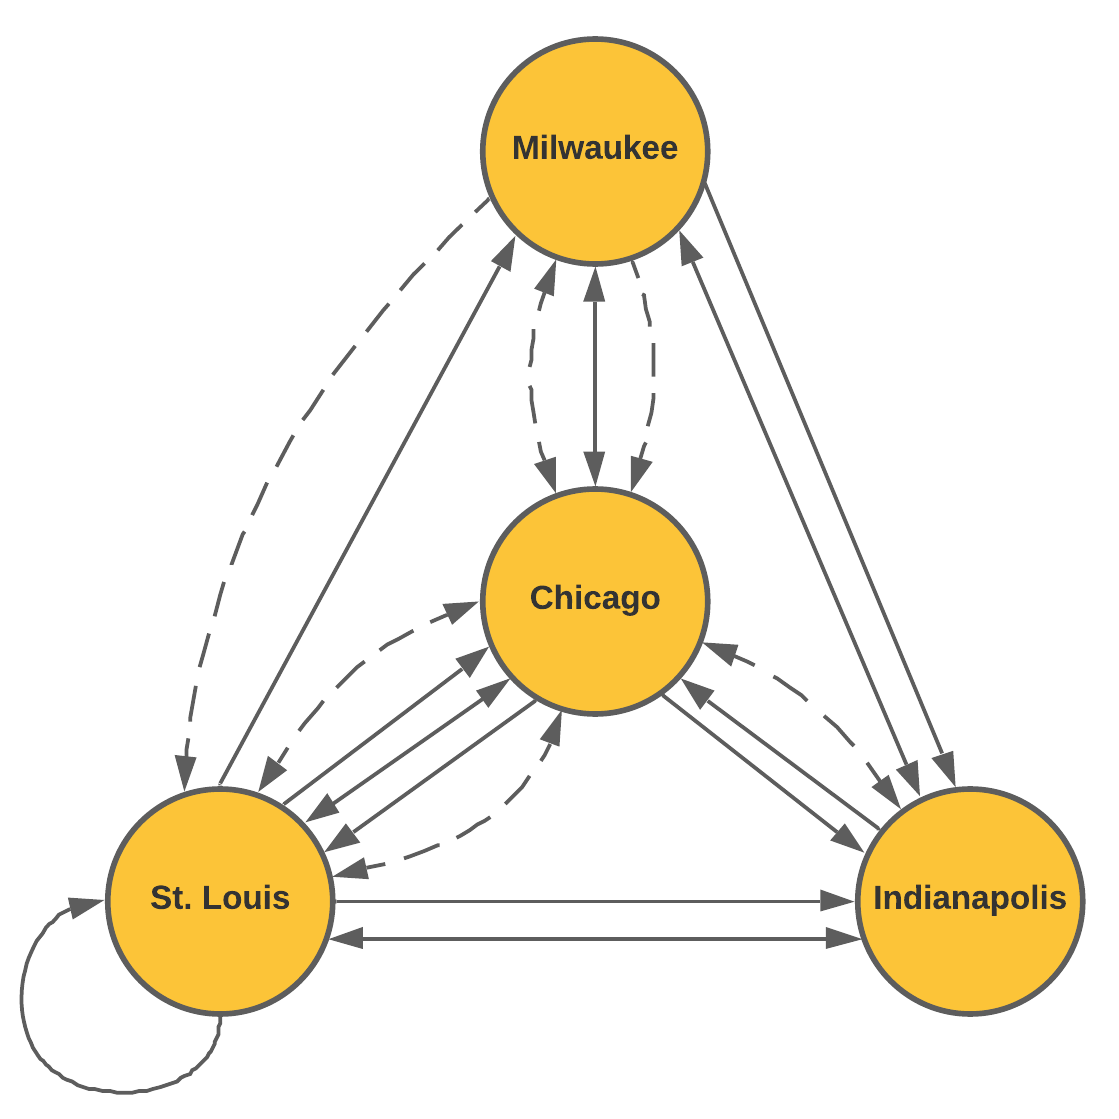
- Matrix B below represents the bus routes. Write a matrix T to represent the train routes connecting the four cities.
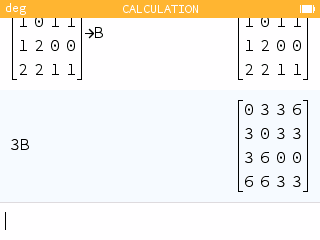
- Suppose the number of bus routes between each city were tripled. What would be the new bus route matrix?
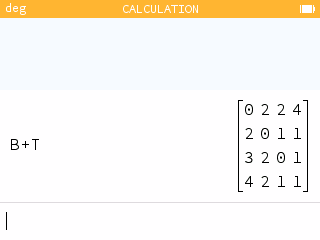
- What would be the meaning of B + T in this situation? Determine the matrix B + T.
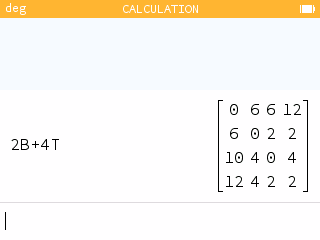
- Write the matrix 2B + 4T and explain what it means in this situation.
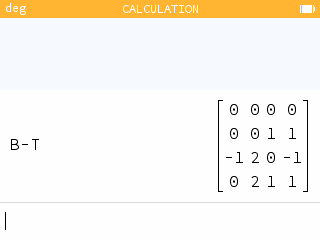
- Determine B - T. Does the matrix B - T have any meaning in this situation? Explain.
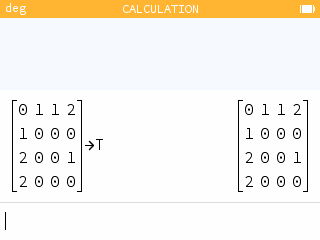
B + T would represent the total number of direct routes regardless of the method of transportation.
2B + 4T represents the total number of routes from each city if the number of bus routes is doubled and the number of train lines is quadrupled.
B - T represents how many more bus routes there are than train lines from each city. A positive value means there are more bus routes than train lines while a negative value represents more train lines than bus routes.
