Olympic Sport Climbing (2 Variables)
Quantitative Data Scatterplot Regression Residuals
Objective
The objective of this activity is to use data from the 2021 Speed Climbing and Lead Climbing Olympic to investigate relationships, create regression models, make predictions, and examine residuals.
During the 2021 Summer Olympics in Tokyo, competition climbing became an Olympic sport for the first time ever. Athletes competed in three separate disciplines: speed climbing, bouldering, and lead climbing. There were 20 men and 20 women who competed in the 2021 Olympic Sports Climbing Qualification Rounds.
In speed climbing, two climbers race side-by-side to scale identical routes on a 15m high wall set at an angle of 95 degrees.
The walls used for bouldering present a range of challenges, with overhangs and some holds so small that they can only be held by the fingertips. Climbers must plan each move carefully while constantly being aware of the 4 minute time limit. The goal is to complete as many routes as possible.
When lead climbing, athletes wearing harnesses attached to a climbing rope attempt to climb as high as they can on a taller wall measuring 15-20 meter within six minutes. The wall features 40-60 handholds. Climbers are scored on how far they progress, with each handhold earning 1 point.
Asking Statistical Questions
The table below data gives information about the three disciplines for each athlete in the women's qualification rounds. The data include the time, in seconds, of the speed climb, the number of holds attained in lead climbing, and their ranking in the bouldering competition.
- What do you notice?
- What do you wonder?
Student answers will vary. Encourage students to make observations that relate two variables. Interesting observations: The athlete with the fastest climb in speed climbing had the lowest rank in bouldering. The athlete with the slowest climb in speed climbing attained the fewest holds in lead climbing. Several of the highest ranked bouldering athletes were in the bottom half of the speed climbing times.
Student answers will vary. "I wonder if an athlete that is good at speed climbing is not as good at bouldering?" "I wonder if athletes will perform similarly in speed climbing and lead climbing?"
| Athlete | Speed (s) | Lead (holds) | Bouldering (rank) |
|---|---|---|---|
| MIROSLAW Aleksandra | 6.97 | 12 | 20 |
| JAUBERT Anouck | 7.12 | 16 | 13 |
| SONG Yiling | 7.46 | 13 | 19 |
| NONAKA Miho | 7.55 | 30 | 8 |
| KAPLINA Iuliia | 7.65 | 14 | 18 |
| YIP Alannah | 7.99 | 21 | 16 |
| CONDIE Kyra | 8.08 | 22 | 11 |
| CHANOURDIE Julia | 8.17 | 25 | 15 |
| NOGUCHI Akiyo | 8.23 | 27 | 3 |
| KLINGLER Petra | 8.42 | 16 | 10 |
| PILZ Jessica | 8.51 | 33 | 9 |
| RABOUTOU Brooke | 8.67 | 26 | 2 |
| MACKENZIE Oceania | 8.83 | 15 | 12 |
| GARNBRET Janja | 9.44 | 26 | 1 |
| MESHKOVA Viktoriia | 9.54 | 29 | 6 |
| COXSEY Shauna | 9.65 | 21 | 4 |
| SEO Chaehyun | 10.01 | 40 | 5 |
| KRAMPL Mia | 10.43 | 26 | 14 |
| ROGORA Laura | 10.5 | 25 | 7 |
| STERKENBURG Erin | 11.1 | 7 | 17 |
Source: Olympics.com
Making Predicitons
We wish to investigate the relationship between the athlete's time in Speed Climbing and the number of holds they attained during Lead Climbing. How would you predict the relationship to behave? Would you expect a fast climber in Speed Climbing to attain a high number of holds or a low number of holds in Lead Climbing? Explain your reasoning.
Answers will vary. "Since both of these disciplines require climbing high walls, I predict that athletes with short climb times in Speed Climbing will attain higher holds in Lead Climbing."
Scatterplot and Correlation
- Use your calculator to make a scatter plot of the data on time and number of holds and describe the association between the two variables.
- Fit a linear function to model the relationship of speed and hold attained. Write the equation of your model and interpret the slope in context.
- Determine the correlation coefficient for the data and describe what it means in regards to the data.
A scatterplot can be constructed using the Regression application. Input the time in X1 and the number of holds attained in Y1. Use the Graph tab to view the scatterplot.
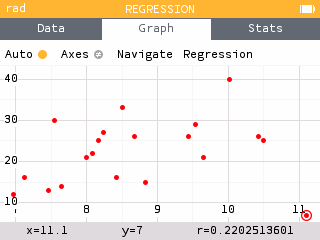
There appears to be a weak, positive, linear relationship between the time in Speed Climbing and the number of holds in Lead Climbing, as supported by an r-value of 0.22. A possible outlier is the athlete with a time of 11.1 seconds and 7 holds.
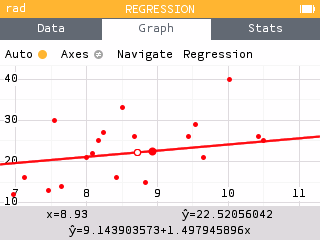
The regression equation can be found by navigating onto the line or in the Regression menu. The model is where is the predicted number of holds attained in lead climbing and is the time in seconds in speed climbing. A slope of means that for every additional one second the climber took to copmlete the speed climbing event, they are expected to obtain 1.498 additional holds on average.
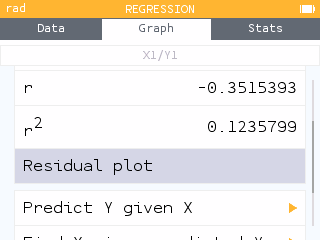
The correlation coefficient is reported in the Stats tab.
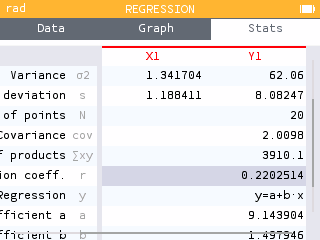
r = 0.2205 confirms that there is a weak, positive, linear relationship between speed climbing time and holds attained in lead climbing.
Regression and Residuals
To investigate the relationship between the athlete's time in Speed Climbing and their rank in Bouldering, a scatterplot and linear model was created as shown below.
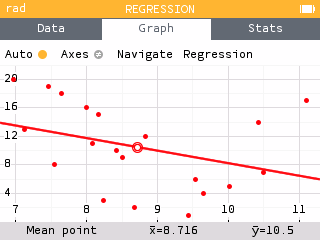
The linear function
has been suggested as a good fit for the data. The table below displays the 20 athlete's time in seconds during Speed Climbing.
- Using the model, determine the predicted rank for the third athlete, Yiling Song. Then compute their residual.
- Interpret the value of the residual for Yiling Song.
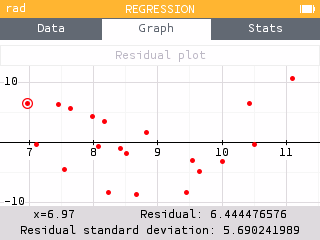
- Create a residual plot for the linear regression of rank on speed for the 20 athletes.
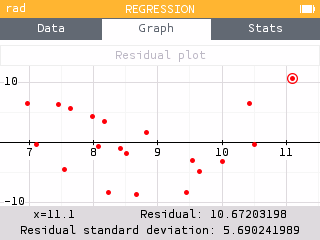
- For which athlete did the model under predict by the most?
- Use the residual plot to determine the goodness of fit of the linear function for the data.
The Predicted Rank is computed using the model . Yiling Song's time was 7.46. Therefore their predicted rank is .
Song's residual can be computed using Rank - Predicted Rank.
A residual of 6.302 means that this athlete ranked about 6 positions higher (worse) than expected by the model, based on their time.
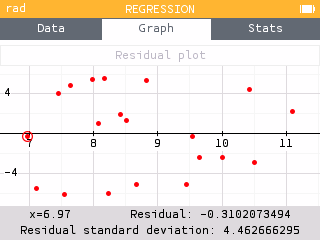
A residual plot can be constructed within the Regression menu.
The model "underpredicts" when the predicted value is less than the observed value. Therefore, we are looking for the largest, positive residual. This occurred for the athlete with a time of 11.1 seconds and ranked 17. The model predicted an athlete with a time of 11.1 seconds would rank around 6th. Thus the model underpredicted by about 11 positions.
There appears to be a pattern in the residual plot. Therefore, a non-linear model is more appropriate.
A Better Model
Perform a quadratic regression on the athlete's time in Speed Climbing and their rank in Bouldering. Assess the fit of the quadratic function by plotting and analyzing the residuals.
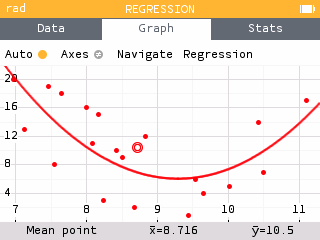
The regression model can be changed to quadratic by selecting Regression in the Graph tab and choosing Quadratic for the model type. The residual plot using a quadratic regression appears to be more randomly scattered than the linear model. This suggests the quadratic model is more appropriate.
For more information on Olympic Sport Climbing: