Version 15
Graph window, units and toolbox
January 08, 2021
Automatic adjustment of the graph window
The new algorithm of the Functions application allows you to adjust the graph window completely automatically! The key elements of the function (extrema, zeros, asymptotes) are automatically taken into account to choose the best possible window. With this, the navigation in the Graph tab has been redesigned.
When you are on the graph window, select the Auto button and press the OK key to request the automatic adjustment of the window. The yellow dot then indicates that the automatic adjustment is activated.
You can also choose the Equal Axes button to request a graph with axes of the same scale. The yellow dot indicates that the graph has equal axes.
The Navigate button allows you to move the window as well as zoom in and out on the graph
Finally, for manual window adjustment, enter your values for Xmin, Xmax, Ymin and Ymax in the Axes menu.
New units
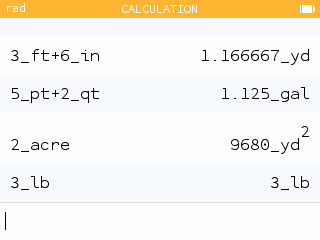
You can now use imperial units in your calculations for lengths, areas, masses, and volumes. All of these units are listed in the Units section of the Toolbox.
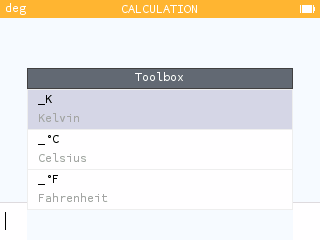
In the Temperature section of Units, you will also find two new units: °C and °F.
Country setting
Some mathematical conventions may vary from country to country. The calculator's initial configuration screen now displays a choice of country, which allows the calculator to be configured to best comply with the conventions in force. This choice can be changed in the Settings application.
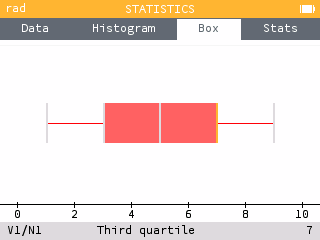
This choice affects in particular the definition of quartiles used in the Statistics application. To have the definition used in the United States, choose the country United States.
And also...
You can use the sequences defined in the Sequences application in the other calculator applications. Press var and go to the Sequences section to see the list of defined sequences.
In the toolbox, the new Vectors section gives you access to functions allowing you to calculate the dot product, the cross product as well as the norm of a vector.
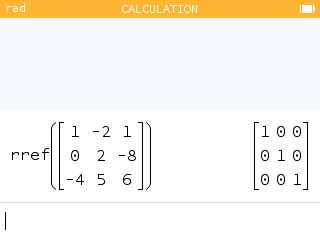
In the Matrices section of the Toolbox, you now have access to functions for calculating the row echelon form and reduced row echelon form of a matrix.
You can now sort the values in the Statistics and Regression application lists in ascending order.
New additional results are available in the Calculations application when the calculation or result is a matrix.
Special thanks
We would like to thank Alexandre André, Joachim Le Fournis et Charlotte Thomas who helped produce this version of the software.