Version 21
Graphing points and improved solving
June 02, 2023
Grapher improvements
Editing an expression is now done directly in the cell that contains it.
The calculator is now able to plot a list of points in the
form of {(1,3),(2,3),(3,5)}. It is also possible to plot a
single point in the form of (1,3).
You can now plot the scatterplot from the data in the
Regression application by typing, for example
(X1,Y1).
Furthermore, the Grapher now plots the
polar line whose equation is in the form θ=a.
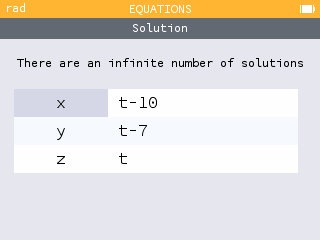
Equations
When a linear system has infinitely many solutions, the calculator now gives the parametrized form of the solutions.
Distributions
In the Distributions application, it is now possible to calculate the value of μ or σ from a Normal probability distribution.
To do this, simply leave the value to be calculated (μ or σ) blank in the second step and then enter the value of the probability. The calculator will then give the requested value below the graph.
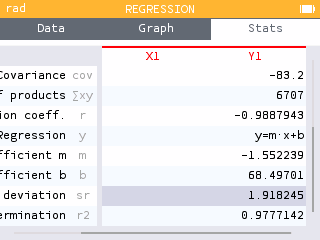
Regression and Statistics
The Regression application now automatically creates the function corresponding to the chosen model. You can find it in the Variables menu. This makes it possible to use the function in other applications such as the Grapher.
The calculator now reports the standard deviation of residuals in the Stats tab of the Regression application.
The Data tab now remembers the formula used when the user generated a column from a formula.
You can now input a value when viewing the cumulative frequency plot and jump to the point on the graph.
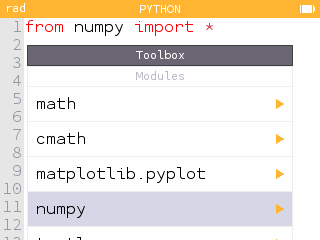
numpy module
It is now possible to use the numpy module of python. This
module allows you to use arrays of 1 and 2 dimensions. You
can now manipulate tables of numbers.
The functions available in the numpy module are listed in the
Modules section of the
toolbox key menu as well as
in the Catalog.
In addition, the gcd() function has been added to the
math module.
But wait, there's more!
This version also offers many other improvements.
The Table tab of the Sequences application now gives the possibility to display a column of the sum of the terms of the sequence.
Pressing the log key now
displays the base number 10. The base number
can then be easily adjusted.
When you use a trigonometric function in radian mode and the argument appears to be in degrees, the calculator reminds you that the angle unit is set to radians, and vice-versa.
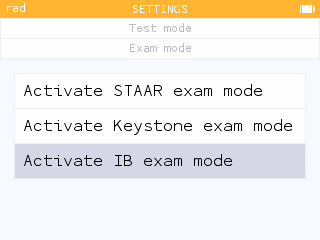
You can now activate exam modes within the Settings application. Learn more about exam compliance.
Finally, when the device is at the lowest battery level, the red battery icon in the status bar flashes for a few seconds to remind the user to recharge the calculator.