Version 7.1
Toolbox and keyboard redesigned, demonstration guides and area of intersection.
September 25, 2026
Toolbox redesigned
The toolbox has been redesigned to match better the NumWorks ecosystem with the same clean and simple categories you love on the handheld calculator.
To help you navigate the robust amount of mathematical operations, we’ve also improved our search bar and added a filter system to categories with many subcategories.
Lastly, you can now resize toolbox and relocate it wherever you need on your screen for maximum flexibility!
Keyboard redesigned
The keyboard has been redesigned too. It now has three tabs to find the keys you may look for easily. In the Basic tab you can find basic keys, in the Advanced tab you can find more complex math keys, and the ABC tab displays the alphabet.
Demonstrations walkthrough
If you're getting started on the board, we now have some guided demonstrations to guide you through our calculator. Five demonstrations are available to show you around. You can learn how to explore graphs, create a slider or a regression model. We also show you how to compare statistical data and solve equations easily.
Area of intersection
You can now highlight areas of intersections. If you graph two or more inequalities, you can click on the Intersection menu next to the Points of interest menu. You can select Area to highlight the area of intersection between inequalities.
Wider range for points of interest
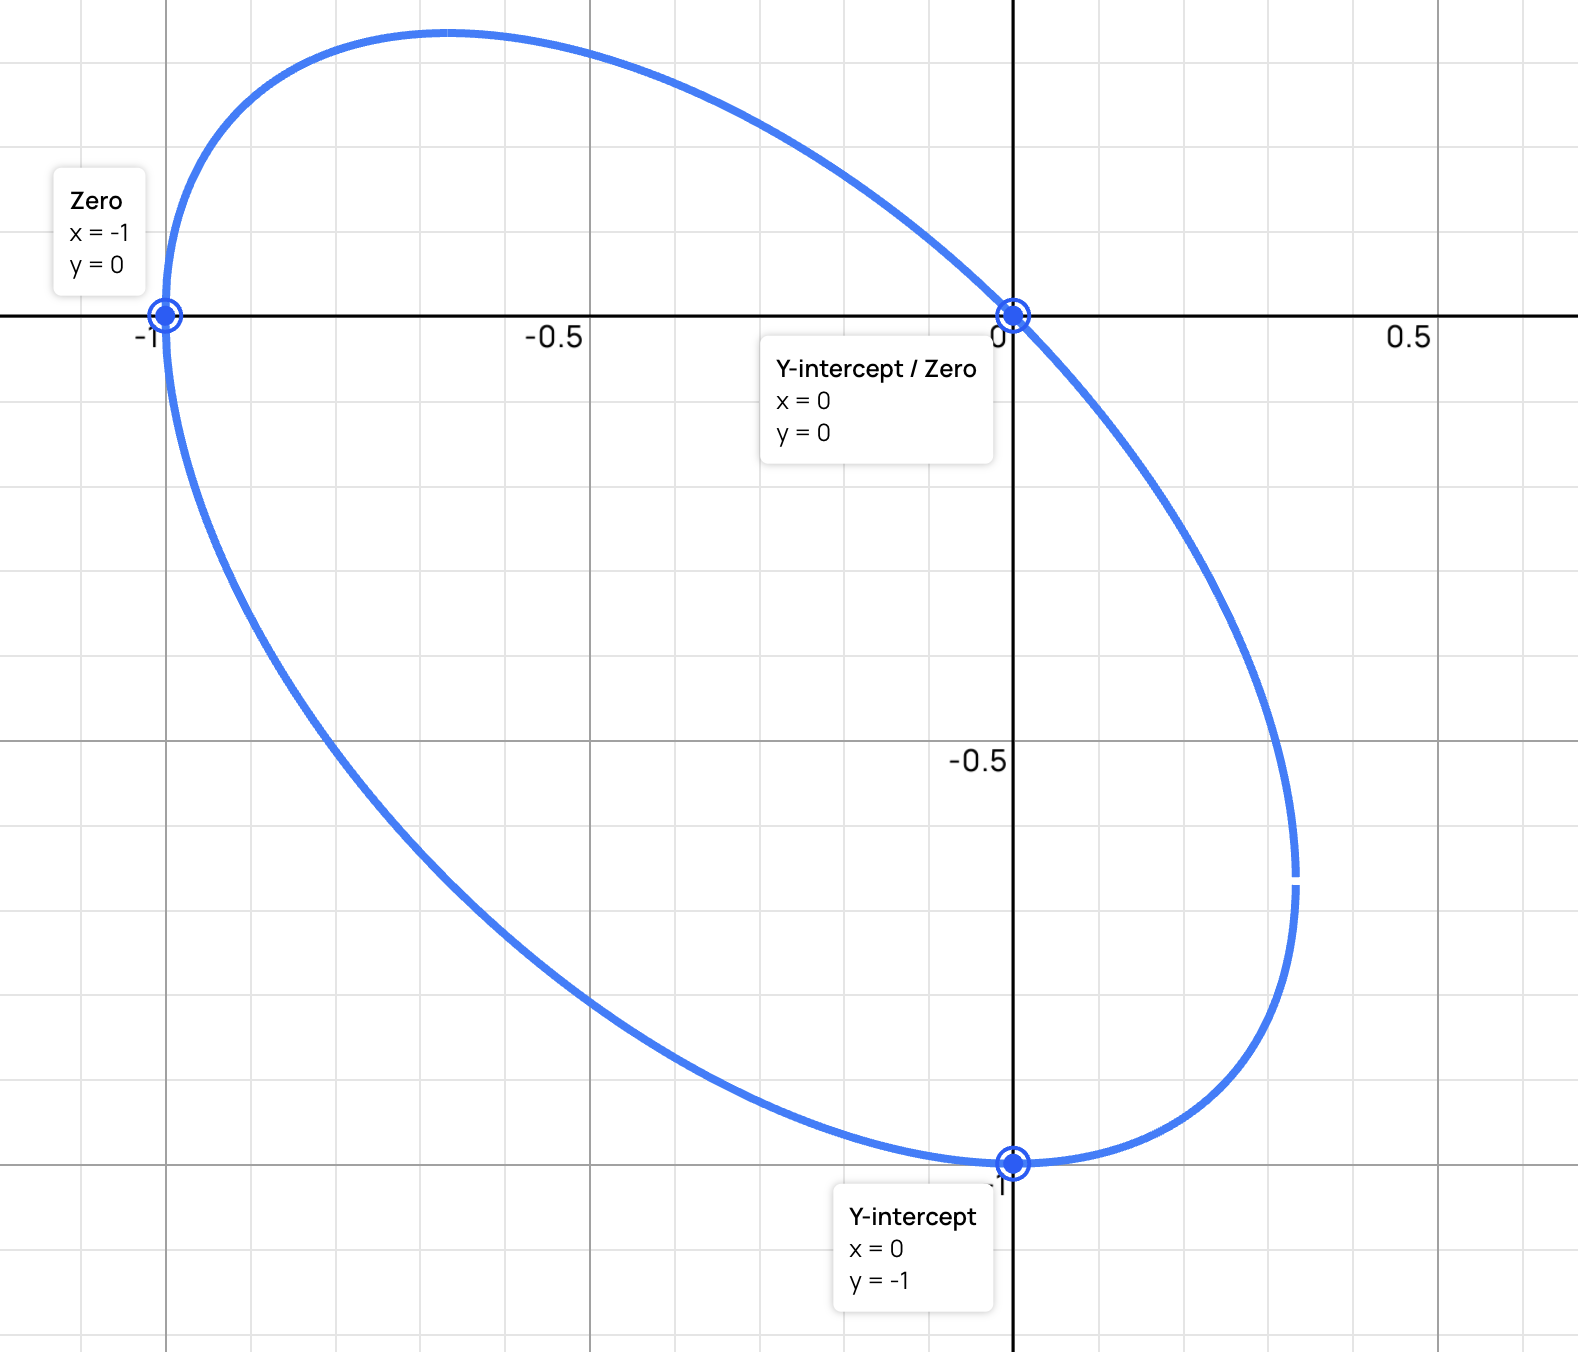
Points of interests can now be visualized for a wider range of equations. Inverse functions, inequalities, implicit functions and inequalities can now display points of interests such as intersection points, zero, minimum and maximum.
Updated features warning
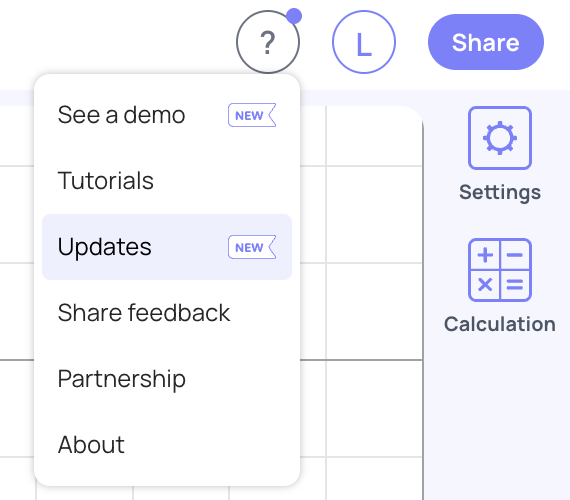
To be more aware of new features coming out, we now display a label to notify if a feature has been updated or is brand new. A purple dot will guide you to the change that has been made.
Link to access updates
You can now access the Updates page about the Board through the Update button in the Help menu.
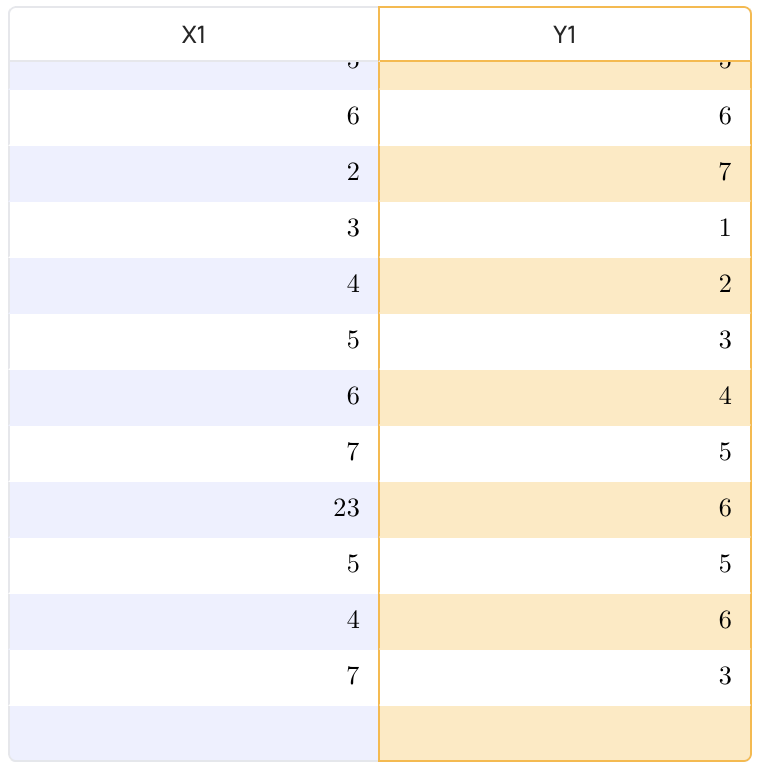
Tables visualization improved
Tables have been slightly modified to see the header better when it's selected. The headers are now also always displayed, even when you scroll down your table.