Version 23
Plotting derivatives, Inference using data, Grapher and Equations improvements.
April 02, 2024
Plotting derivatives of functions
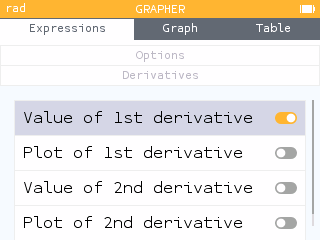
Within the Grapher application, it is now possible to toggle on additional derivatives within the options of a function.
Activating the plot of a derivative adds a derivative element to the Expression tab, plots the derivative on the Graph tab, and adds a column of derivative values to the Table tab.
Within the options of derivatives, you can change the color and hide the plot of the derivative.
The Value of the derivative options allow you to view values of the first and second derivative in the bottom banner of the Graph tab without viewing the plot.
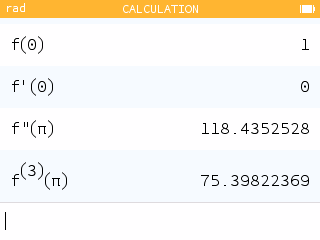
Recognition of the notation f', f'' and
f(n)
In all applications other than Python, pressing
Alpha then
Toolbox now creates a single
apostrophe ' (instead of a double quote ").
The notation f' and f" is now
recognized to designate the first derivative and the
second derivative of the function f. The
notation f(n) is used for
additional derivatives.
Value of derivatives - Polar and parametric curves
You can now view derivative values of Polar and Parametric curves in the Grapher application.
Within the options menu of a polar or parametric curve, you can now activate the first and second derivative values.
This allows you to view the values of the derivatives as you trace the curve in the Graph tab as well as in a column of the Table tab.
We've also added two new features within the Find menu for Polar and Parametric curves.
You can now find dy/dx for given values of theta or t.
You can also find the equation of the line tangent to polar and parametric curves.
More improvements to the Grapher application
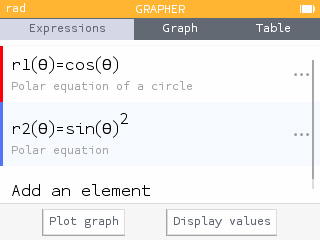
Polar functions are now defined in the form r1(θ) and are saved and accessible in the variables menu.
Parametric functions are now defined in the form f(t)=(fx(t), fy(t)). Parametric functions are stored in the variable menu as three independent functions: fx(t) and fy(t) and f(t).
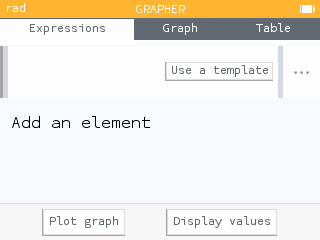
The templates for graphing have been moved to a button to the right of a new expression. This enables you to start entering an expression right away while still having access to all your favorite templates.
You now have access to a Polar grid within the Axis menu of the Graph tab under Grid Type.
Search interval for solving equations
We've made solving advanced equations even easier! A search interval is now automatically created.
You can then define the search interval to look for solutions within a specific domain.
Using data in the Inference app
We've added the ability to use a dataset for significance tests and confidence intervals about the mean in the Inference application.
When performing a significance test or constructing a confidence interval for a mean, you can now import a dataset that is already saved in the Statistics application.
You can also input a new dataset directly within the significance test or confidence interval.
Once the dataset is selected or inputted, the Calculated values will include the sample mean and sample standard deviation.
For slope tests and intervals, it is now possible to choose between all data sets of the Regressions application.
But wait, there's more!
Version 23 offers additional improvements to the calculator.
In the Python application, the distance() function has been added to the turtle method. The "@" operator is now available in the toolbox.