Version 19
Statistics, Regressions and Lists
June 01, 2022
New graphs and improvements to the Statistics application
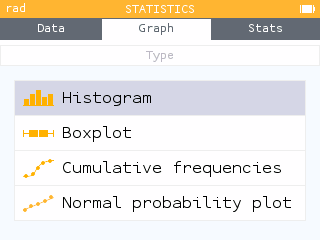
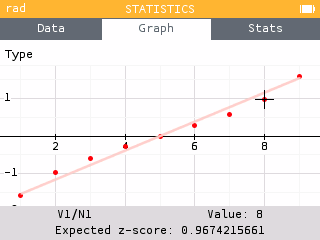
The Statistics application now offers a new Graph tab where you can choose four different representations of your data. To change the representation, select the Type item under the tab bar and press OK.
The Boxplot graph has also been revised so that the selected element is now more visible. Outliers are also displayed. It is possible to hide outliers by selecting the Settings item under the tab bar and deactivating the option.
Among the representations, you can now choose to draw the Cumulative relative frequency graph. The legend shows the values of the selected data point as well as the cumulative relative frequency, as a percentage.
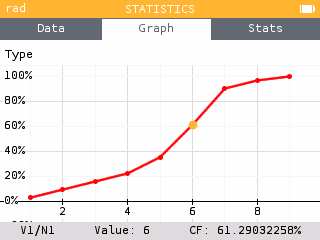
You can also display the cumulative frequency column in the Data tab by selecting the first row of the data table and pressing OK.
You can also choose to draw a Normal probability plot to compare the distribution of your data with a Normal distribution.
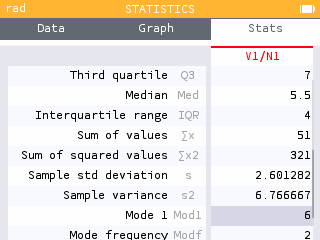
In the Stats tab you can now read the value of the mode along with its frequency.
In the Data tab it is possible to deactivate a data table so that it does not appear in the graphs, nor in the statistical calculations of the Stats tab.
Scatterplot and Regressions application improvements
The Regression application has been revised so that the data is first displayed as a scatterplot. This provides the opportunity to view the data before applying a regression model.
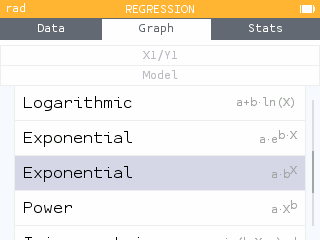
Depending on the observed trend, you can then add a regression model by pressing OK or by selecting the Regression item under the tab bar.
Two new regression models are added: the median-median model as well as the exponential model of form a*b^x.
The graph legend has been minimized to allow more space for visualization. All regression information is now accessible in the Regression menu under the tab bar or by pressing OK.
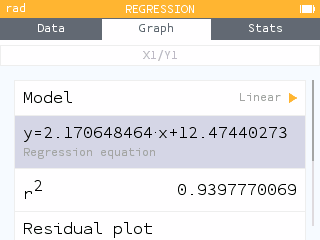
In particular, it is possible to copy the expression of the regression model to paste it into the Graph application for example.
You can now display the residual plot for any regression model by going to the Regression menu and choosing Residual plot.
Similar to the Statistics application, it is also possible to deactivate a data table from the Data tab so that it does not appear on the graph.
List Support
The calculator is now able to manage lists as accessible objects. All the lists you have created are available in the var key menu. Lists of data entered in the Statistics and Regressions applications are also available in this menu and accessible in other applications.
Use braces to define a list. You will find them in the Toolbox key menu. You can call an element using parentheses.

In all lists, the index of the first element is 1. To call the fourth element of the list L, you can therefore type L(4).
The Lists section of the Toolbox provides access to all sorts of list functions and operations. In particular, it contains the function that allows you to generate a list.
When filling in a data table in the Statistics or Regression applications, the var key menu provides access to this data for use in another application.
When you want to generate a list of values in the Statistics or Regressions applications, you can use the Fill with Formula feature.
The calculator then offers formula templates that you can use to generate a series of values.
Probabilities and Statistical Tests
Significance tests now showcase a new visual on the conclusion screen for easy comparison of the p-value and alpha. It is also possible to zoom in and out.
It is now possible to perform a significance test for the slope of a regression line. The associated confidence interval is also available.
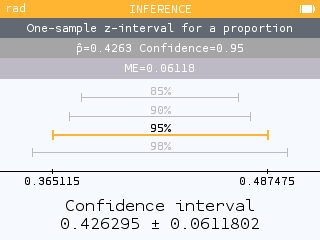
Confidence Intervals now have a new visual on the conclusion screen.
Other improvements regarding probabilities and statistical tests have also been made.
- It is now possible to calculate an inverse probability for the Student's t-distribution.
- The chi-square test for Homogeneity/Independence now calculates the contributions to the chi-square value.
- When performing a z-test for two proportions, the calculator now displays the calculated value of the pooled/combined proportion.
- The toolbox offers the functions associated with the following probability distributions: Poisson, Student's t and Geometric.
But wait, there's more!
This version also offers many other improvements.
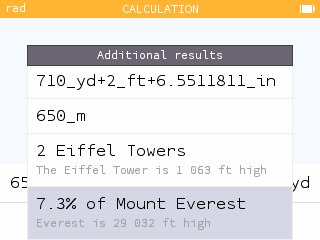
New additional results are available for calculations with units. The results are compared to reference quantities.
In the Grapher and Sequences applications, it is now possible to choose the color of the curve or representation.
The % symbol can now be used in the
Calculation application to perform calculations with
percentages.

A new Press-to-test feature allows you to deactivate exact results.
-
Inputs of type
xln(x)are now understood asx*ln(x). Learn more about our improved parser in our blog post. - The heap of the Python application has been increased to 64kB and the storage memory has been increased to 42kB.
- The numerical algorithm for calculating integrals has been improved.
-
Recursive calculations using
Ansin the Calculation application are more efficient and lead to a memory full error less often. - Shortcut: it is now possible to use the number keys on the keyboard to select the different applications from the home menu. The one key corresponds to Calculation, two key corresponds to Grapher, etc. Pressing the number key twice opens the corresponding application.
-
Shortcut: pressing the
- key twice will enter
Ans-instead of just-. -
The characters
eandiare now the characters used for the e of the exponential and the complex number i. Indexing of sums and products now uses the variable k. - The new Advanced graphing Press-to-test option disables implicit plots and grapher details.
Note about the N0100 model
The memory of the N0100 model does not accommodate all the new features described in the notes above. Most of the new features have been included, however some are missing: use of percentages in the Calculations application, functions that take lists as arguments, inference calculations on the slope of a regression line, comparison of results comprising units with reference quantities and the availability of certain probability functions in the toolbox.